1.1. About Regional Research Station, Paiyur
The Regional Research Station, Paiyur is the implementing centre which was started in the year 1973. It is catering to the needs of rainfed farming community of the North Western zone. So for, 16 varieties have been evolved and released in the crops namely, Paddy (Paiyur 1), Ragi (Paiyur 1 and 2), Samai (Paiyur 1 and 2), Sorghum Paiyur (1 and 2), Green gram (Paiyur 1), Cow pea (Paiyur 1), Horse gram (Paiyur 1& 2), Sesame (Paiyur 1), Niger (Paiyur 1), Cotton (Paiyur 1), Tomato (Paiyur 1) and Mango (Paiyur 1). Besides the varieties, the crop management technologies released are found to be of importance in improving the productivity levels. Also, this station is producing and supplying large quantities of seeds of Paddy, Tomato, Moringa, Gourds, Bhendi, Mango grafts, Guava layers and bio-inoculants namely, Azospirillum, Azotobactor, Rhizobium, PSB, Trichoderma, Psuedomonas and vermicompost. Various training programmes are offered to farmers, extension officials and other beneficiaries in the fields of agriculture, horticulture and allied enterprises.
Scientists involved
| Dr. M. Tamilselvan |
Professor and Head |
| Dr. P.Senthilkumar |
Assistant Professor (Nematalogy) |
1.2. Brief introduction about the Sub basin
1.2. a. Pennaiyar River Basin
The Pennaiyar River has its origin in the South Eastern slopes of Chennakesava hills in Nandhidurg in Karnataka state and after traversing about 110 km in Karnataka state it enters in Tamil Nadu in Hosur taluk and flows through Hosur, Krishnagiri and Uthangarai Taluks of Krishnagiri District and Harur taluk of Dharmapuri District for a length of 190 km. After traversing in Dharmapuri District, the Pennaiyar river enters into Thiruvannamalai, Vilupuram, Cuddalore district and travels a distance of 132 km. The Pennaiyar river finally empties into the Bay of Bengal near Cuddalore. The total drainage area of Pennaiyar including the area in Karnataka state is 15101 sq.km. The catchment area in Karnataka state is 2384. sq. km and in Tamil Nadu state is 12717 sq.km. The total length of river is 432km. (i.e) 322km in Tamil Nadu and 110 km in Karnataka state.
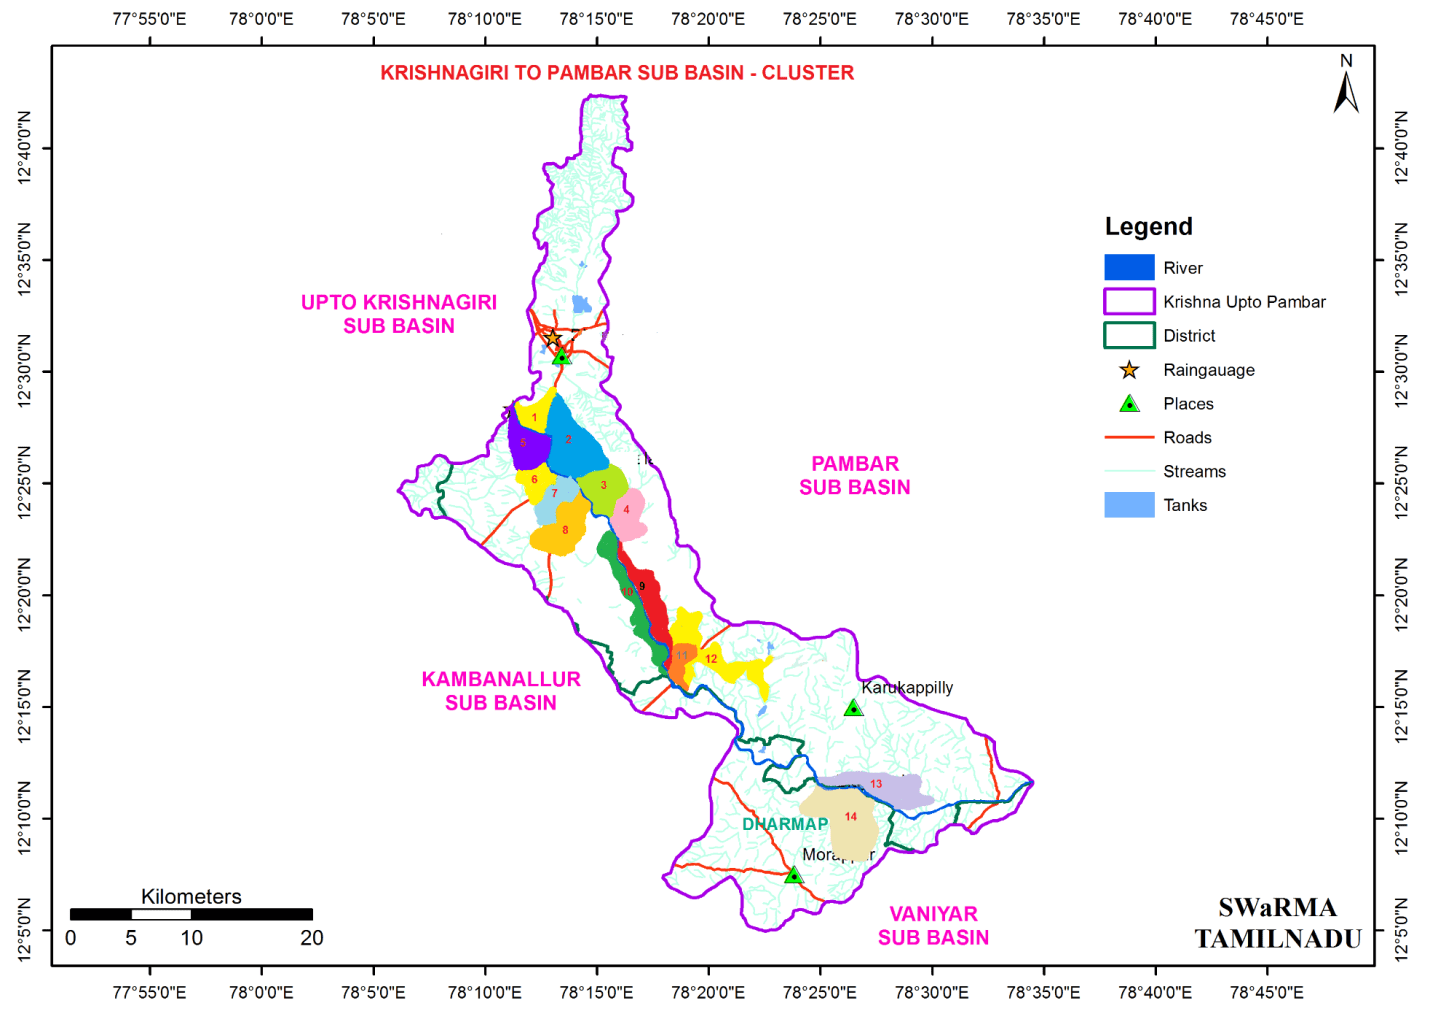
2. Krishnagiri to Pambar Sub-Basin
Pennaiyar River basin has been divided into 18 sub basins. The Krishnagiri to Pambar sub basin (Fig. 1) is one of the major sub basins in the Pennaiyar basin. This sub basin is located between latitude of 12o 06’ 30” to 12o 42’10” and longitude of 78o 06’10’’ E to 78o 35’ 40”. The total Ayacut for this sub basin is 8397.36 Ha. There are 3anicuts, 11 Supply Channel and 37 system tanks involved in the Krishnagiri to Pambar Sub basin. There is a seasonal flow in the river during monsoon seasons. The Krishnagiri to Pambar Sub basin area is 903.73 sq.km. The sub basin covered in Krishnagiri, Pochampalli and Uthangarai taluks of Krishnagiri district and Harur, Palacodetaluks of Dharmapuri District and covered 9 blocks namely as Harur, Morappur,Uthangarai, Mathur, Karimangalam, Kaveripatinam, Bargur, Krishnagiri and Veppanapalli.
2.1 Blocks covered
There are 9 Revenue blocks in this sub-basin.
| Sl. No |
Name of Block |
Total Block area (sqkm) |
Block area falls in sub basin (sqkm) |
% of block falls in sub basin |
Total sub basin net potential Mcum |
Level of Exploitation |
| 1. |
Harur |
881 |
61.489 |
6.98 |
96.71 |
Over Exploited |
| 2. |
Morappur |
562 |
142.16 |
25.3 |
|
Over Exploited |
| 3. |
Uthangarai |
401 |
147.291 |
36.73 |
|
Over Exploited |
| 4. |
Mathur |
215 |
53.098 |
24.7 |
|
Over Exploited |
| 5. |
Karimangalam |
348 |
12.667 |
3.64 |
|
Over Exploited |
| 6. |
Kaveripattinam |
329 |
299.828 |
91.13 |
|
Semi Critical |
| 7. |
Bargur |
474 |
34.797 |
7.34 |
|
Over Exploited |
| 8. |
Krishnagiri |
333 |
128.334 |
38.54 |
|
Semi Critical |
| 9. |
Veppanapalli |
313 |
24.067 |
7.69 |
|
Over Exploited |
2.2 Registered Ayacut area details and Irrigation potential of Krishnagiri to Pambar sub basin
| Particulars |
Krishnagiri |
Dharmapuri |
Total |
| Fully irrigated area (ha) |
785.00 |
4130.16 |
4915.16 |
| Partially irrigated area(ha) |
115.00 |
1028.96 |
1143.96 |
| Gap(ha) |
281.00 |
2057.25 |
2338.25 |
| Permenant Gap(ha) |
- |
- |
- |
| Total ayacut area (ha) |
1181.00 |
7216.36 |
8397.36 |
2.3. Details of Cluster Village in Krishnagiri to Pambar sub basin
Krishnagiri to Pambar Sub-basin - Cluster wise / Channel wise / Tank wise / Village wise Convergent Table
| Sl. No |
Cluster Name |
Name of the Anaicut/Channel |
Region Tank_ No |
Unique_ID |
Name of the Tank |
Village |
Block |
District |
Total Ayacut (ha) |
Gap Area |
| Reg.Ayacut |
Fully Irr. |
Part.Irr |
RF/Fallow |
Per. Gap |
| I |
SYSTEM TANKS |
|
|
|
|
|
|
|
|
|
|
|
|
Cluster 1 |
|
|
|
|
|
|
|
|
|
|
|
|
|
|
|
2692 |
TNPE-17-T0050 |
Mohammad Ghouse Tank |
Periyamuthur |
Krishnagiri |
Krishnagiri |
30.455 |
15.00 |
5.00 |
10.46 |
|
|
|
|
2692 |
TNPE-17-T0050 |
Mohammad Ghouse Tank |
Sundekuppam |
Kaveripattinam |
Krishnagiri |
11.015 |
7.03 |
2.00 |
1.985 |
|
|
|
|
|
|
|
|
|
|
|
|
|
|
|
|
|
|
2584 |
TNPE-17-T0059 |
ChinnagoundanEri |
Sundekuppam |
Kaveripattinam |
Krishnagiri |
29.79 |
18.15 |
4.19 |
7.45 |
|
|
Cluster 2 |
|
|
|
|
|
|
|
|
|
|
|
|
|
|
|
2851 |
TNPE-17-T0062 |
Thimmapuram Tank |
Sundekuppam |
Kaveripattinam |
Krishnagiri |
11.015 |
6.155 |
1.50 |
3.36 |
|
|
|
|
2851 |
TNPE-17-T0062 |
Thimmapuram Tank |
Thimmapuram |
Kaveripattinam |
Krishnagiri |
210.765 |
115.195 |
31.98 |
63.59 |
|
|
Cluster 3 |
|
|
|
|
|
|
|
|
|
|
|
|
|
|
|
2568 |
TNPE-17-T0065 |
Malaiyandahalli Tank |
Sevattahalli |
Kaveripattinam |
Krishnagiri |
17.08 |
9.52 |
2.21 |
5.35 |
|
|
|
|
2766 |
TNPE-17-T0075 |
Thalihalli Tank |
Thalihalli |
Kaveripattinam |
Krishnagiri |
117.4 |
71.52 |
7.63 |
38.25 |
|
|
Cluster 4 |
|
|
|
|
|
|
|
|
|
|
|
|
|
|
|
2596 |
TNPE-17-T0077 |
Anankuttai Tank |
Marichettihalli |
Kaveripattinam |
Krishnagiri |
36.42 |
21.41 |
5 |
10.01 |
|
|
Cluster 5 |
|
|
|
|
|
|
|
|
|
|
|
|
|
|
|
2575 |
TNPE-17-T0063 |
PuduEri |
Kundalapatti |
Kaveripattinam |
Krishnagiri |
25.95 |
9.85 |
9.25 |
6.85 |
|
|
|
|
2611 |
TNPE-17-T0066 |
Kurubampatti |
Kundalapatti |
Kaveripattinam |
Krishnagiri |
42.66 |
18.91 |
9.64 |
14.11 |
|
|
|
|
2541 |
TNPE-17-T0084 |
GopalaJoshiyarKuttai |
Kundalapatti |
Kaveripattinam |
Krishnagiri |
10.93 |
6.12 |
2.3 |
2.51 |
|
|
|
|
2552 |
TNPE-17-T0071 |
Ellukuttai |
Kundalapatti |
Kaveripattinam |
Krishnagiri |
6.04 |
4.25 |
0.78 |
1.01 |
|
|
|
|
2536 |
TNPE-17-T0073 |
Mittahalli Tank |
Mittahalli |
Kaveripattinam |
Krishnagiri |
5.72 |
3.05 |
1.66 |
1.01 |
|
|
Cluster 6 |
|
|
|
|
|
|
|
|
|
|
|
|
|
|
|
2641 |
TNPE-17-T0074 |
Suriyanarayanan Tank |
Sandhapuram |
Kaveripattinam |
Krishnagiri |
61.51 |
36.25 |
7.08 |
18.18 |
|
|
|
|
2535 |
TNPE-17-T0078 |
MitchukanKuttai |
Sandhapuram |
Kaveripattinam |
Krishnagiri |
7.91 |
5.1 |
1.73 |
1.08 |
|
|
|
|
2558 |
TNPE-17-T0076 |
Gollapatti Tank |
Sandhapuram |
Kaveripattinam |
Krishnagiri |
12.08 |
6.76 |
2.10 |
3.22 |
|
|
Cluster 7 |
|
|
|
|
|
|
|
|
|
|
|
|
|
|
|
2526 |
TNPE-17-T0082 |
Kalleri Tank |
Errahalli |
Kaveripattinam |
Krishnagiri |
3.55 |
2.10 |
0.60 |
0.85 |
|
|
|
|
2604 |
TNPE-17-T0083 |
Nadu Eri |
Errahalli |
Kaveripattinam |
Krishnagiri |
38.43 |
21.18 |
7.00 |
10.25 |
|
|
|
|
2562 |
TNPE-17-T0090 |
Errahalli Tank |
Errahalli |
Kaveripattinam |
Krishnagiri |
21.9 |
14.89 |
1.44 |
5.57 |
|
|
|
|
2530 |
TNPE-17-T0086 |
Oddankuttai |
Errahalli |
Kaveripattinam |
Krishnagiri |
5.39 |
2.54 |
0.87 |
1.98 |
|
|
|
|
2532 |
TNPE-17-T0081 |
Senguttai Tank |
Errahalli |
Kaveripattinam |
Krishnagiri |
3.56 |
2.01 |
0.60 |
0.95 |
|
|
Cluster 8 |
|
|
|
|
|
|
|
|
|
|
|
|
|
|
|
2525 |
TNPE-17-T0092 |
ManikanoorEri |
Jagadapp |
Kaveripattinam |
Krishnagiri |
2.95 |
1.25 |
0.69 |
1.01 |
|
|
|
|
2671 |
TNPE-17-T0096 |
PaiyurEri |
Paiyur |
Kaveripattinam |
Krishnagiri |
54.01 |
26.21 |
8.69 |
19.11 |
|
|
|
|
2542 |
TNPE-17-T0094 |
KottayoorEri |
Jagadapp |
Kaveripattinam |
Krishnagiri |
10.1 |
6.675 |
1.095 |
2.33 |
|
|
|
|
2547 |
TNPE-17-T0097 |
PappanEri |
Jagadapp |
Kaveripattinam |
Krishnagiri |
15.35 |
8.36 |
2.08 |
4.91 |
|
|
|
|
2524 |
TNPE-17-T0089 |
AlamarathuKuttai Tank |
Paiyur |
Kaveripattinam |
Krishnagiri |
2.18 |
1.05 |
0.33 |
0.8 |
|
|
|
|
2693 |
TNPE-17-T0085 |
Mallappan Tank |
Penneswaramadam |
Kaveripattinam |
Krishnagiri |
84.58 |
46.25 |
9.19 |
29.14 |
|
|
Cluster 9 |
|
|
|
|
|
|
|
|
|
|
|
|
|
|
|
2812 |
TNPE-17-T0103 |
Maruderi tank |
Maruderi |
Kaveripattinam |
Krishnagiri |
30.36 |
18.21 |
2.90 |
9.25 |
|
|
|
|
2813 |
TNPE-17-T0104 |
Vilangamudi tank |
Vilangamudi |
Kaveripattinam |
Krishnagiri |
45.58 |
26.15 |
5.76 |
13.67 |
|
|
|
|
2906 |
TNPE-17-T0115 |
Barur small tank |
Barur |
Kaveripattinam |
Krishnagiri |
46.78 |
32.25 |
6.11 |
8.42 |
|
|
Cluster 10 |
|
|
|
|
|
|
|
|
|
|
|
|
|
|
|
2889 |
TNPE-17-T0099 |
Nedungal Tank |
Nedungal |
Kaveripattinam |
Krishnagiri |
45.38 |
32.12 |
3.74 |
9.52 |
|
|
|
|
2847 |
TNPE-17-T0102 |
Achukuttai Tank |
A.Mottur |
Kaveripattinam |
Krishnagiri |
47.36 |
31.91 |
5.97 |
9.48 |
|
|
|
|
2870 |
TNPE-17-T0110 |
Deveerahalli Tank |
Kudimenahalli |
Kaveripattinam |
Krishnagiri |
80.72 |
51.21 |
8.11 |
21.4 |
|
|
|
|
2901 |
TNPE-17-T0113 |
Pannandur Tank |
Pannandur |
Kaveripattinam |
Krishnagiri |
62.8 |
41.01 |
3.21 |
18.58 |
|
|
|
|
2769 |
TNPE-17-T0121 |
Vadmangalam Tank |
Vadamangalam |
Kaveripattinam |
Krishnagiri |
43.33 |
32.15 |
2.95 |
8.23 |
|
|
Cluster 11 |
|
|
|
|
|
|
|
|
|
|
|
|
|
|
|
2775 |
TNPE-17-T0129 |
Thippanankuttai Tank |
Bendarahalli |
Kaveripattinam |
Krishnagiri |
19.97 |
8.125 |
4.835 |
7.01 |
|
|
|
|
2992 |
TNPE-17-T0111 |
Barur Big Tank - West main canal |
Barur |
Kaveripattinam |
Krishnagiri |
|
|
|
|
|
|
|
|
|
|
|
Bendarahalli |
Kaveripattinam |
Krishnagiri |
|
|
|
|
|
|
|
|
|
|
Sub Total for Barur big tank |
|
|
|
329.42 |
228.15 |
21.75 |
79.52 |
|
|
Cluster 12 |
|
2992 |
TNPE-17-T0111 |
Barur Big Tank - East main canal |
Barur |
Kaveripattinam |
Krishnagiri |
|
|
|
|
|
|
|
|
|
|
|
Keelkuppam |
Kaveripattinam |
Krishnagiri |
|
|
|
|
|
|
|
|
|
|
|
Kottapatti |
Kaveripattinam |
Krishnagiri |
|
|
|
|
|
|
|
|
|
|
|
Gingalkathirampatti |
Kaveripattinam |
Krishnagiri |
|
|
|
|
|
|
|
|
|
|
|
Thadampatti. |
Bargur |
Krishnagiri |
|
|
|
|
|
|
|
|
|
|
Sub Total for Barur big tank |
|
|
|
640.8 |
401.84 |
83.13 |
155.83 |
|
|
|
|
2659 |
TNPE-17-T0122 |
PuliyurJamberi Tank |
Kottapatti |
Kaveripattinam |
Krishnagiri |
81.32 |
59.12 |
7.94 |
14.26 |
|
|
|
|
2573 |
TNPE-17-T0126 |
Kottappatti Tank |
Kottapatti |
Kaveripattinam |
Krishnagiri |
4.33 |
2.15 |
1.22 |
0.96 |
|
|
|
Sub Total I |
|
|
|
|
|
|
2356.89 |
1451.18 |
284.26 |
621.45 |
|
| II |
SUPPLY CHANNELS |
|
|
|
|
|
|
|
|
|
|
|
|
Cluster 1 |
KRP Dam Left Main Canal LS 0 m to 4500 m |
|
|
|
Periyamuthur |
Krishnagiri |
Krishnagiri |
366.57 |
215.31 |
70.005 |
81.255 |
|
|
Cluster 2 |
KRP Dam Left Main Canal LS 4500 m to 9000 m |
|
|
|
Sundekuppam |
Kaveripattinam |
Krishnagiri |
401 |
245.95 |
53.5 |
101.55 |
|
|
Cluster 3 |
KRP Dam Left Main Canal LS 9000 m to 14500 m |
|
|
|
Sevattahalli |
Kaveripattinam |
Krishnagiri |
299.22 |
171.05 |
23.45 |
104.72 |
|
|
|
Thallihalli Supply Channel |
|
|
|
Thalihalli |
Kaveripattinam |
Krishnagiri |
121.4 |
42.55 |
31.8 |
47.05 |
|
|
|
Ramapuram Supply Channel |
|
|
|
Sevattahalli |
Kaveripattinam |
Krishnagiri |
95.5 |
36.89 |
19.7 |
38.91 |
|
|
Cluster 4 |
KRP Dam Left Main Canal LS 14500 m to 17000 m |
|
|
|
Thalihalli |
Kaveripattinam |
Krishnagiri |
241 |
115.25 |
38.5 |
87.25 |
|
|
|
KRP Dam Left Main Canal LS 17000 m to 18200 m |
|
|
|
Baleguli |
Kaveripattinam |
Krishnagiri |
100 |
45.12 |
15.76 |
39.12 |
|
|
Cluster 5 |
KRP Dam Right Main Canal LS 0 m to 3200 m |
|
|
|
Kalvehalli |
Kaveripattinam |
Krishnagiri |
270.345 |
201.285 |
41.05 |
28.01 |
|
|
|
KRP Dam Right Main Canal LS 3200 m to 6000 m |
|
|
|
Kundalapatti |
Kaveripattinam |
Krishnagiri |
222.675 |
111.35 |
49.015 |
62.31 |
|
|
|
KRP Dam Right Main Canal LS 6000 m to 9000 m |
|
|
|
Mittahalli |
Kaveripattinam |
Krishnagiri |
300 |
132.57 |
57.18 |
110.25 |
|
|
|
Sandhapuram Supply Channel |
|
|
|
Sandhapuram |
Kaveripattinam |
Krishnagiri |
42.08 |
18.56 |
12.51 |
11.01 |
|
|
Cluster 7 |
KRP Dam Right Main Canal LS 9000 m to 12000 m |
|
|
|
Errahalli |
Kaveripattinam |
Krishnagiri |
280 |
158.51 |
21.64 |
99.85 |
|
|
Cluster 8 |
KRP Dam Right Main Canal LS 12000 m to 14200 m |
|
|
|
Errahalli |
Kaveripattinam |
Krishnagiri |
247.81 |
125.65 |
30.92 |
91.24 |
|
|
Cluster 10 |
Nedungal Supply Channel |
|
|
|
Nedungal |
Kaveripattinam |
Krishnagiri |
62.43 |
16.25 |
28.08 |
18.1 |
|
|
|
Achukuttai Supply Channel |
|
|
|
A.Mottur |
Kaveripattinam |
Krishnagiri |
7.04 |
3.11 |
2.92 |
1.01 |
|
|
|
Deveerahalli Supply Channel |
|
|
|
Kudimenahalli |
Kaveripattinam |
Krishnagiri |
80.97 |
28.65 |
31.03 |
21.29 |
|
|
|
Pannandhur Supply Channel |
|
|
|
Pannandur |
Kaveripattinam |
Krishnagiri |
15.77 |
6.25 |
6.37 |
3.15 |
|
|
|
Vadamangalam Supply Channel |
|
|
|
Vadamangalam |
Kaveripattinam |
Krishnagiri |
16.93 |
4.95 |
6.73 |
5.25 |
|
|
Cluster 11 |
Arasampatti River Channel |
|
|
|
Arasampatti |
Kaveripattinam |
Krishnagiri |
24.6 |
6.25 |
7.37 |
10.98 |
|
|
|
Sub Total II |
|
|
|
|
|
|
3195.34 |
1685.50 |
547.53 |
962.31 |
|
|
|
|
|
|
|
|
|
|
|
|
|
|
|
| III |
ANICUTS |
|
|
|
|
|
|
|
|
|
|
|
|
Cluster 9 |
NedungalAnicut and Its supply channel |
|
|
|
Maruderi |
Kaveripattinam |
Krishnagiri |
|
|
|
|
|
|
|
|
|
|
|
Vilangamudi |
Kaveripattinam |
Krishnagiri |
|
|
|
|
|
|
|
|
|
|
|
Sellakuttapatti |
Kaveripattinam |
Krishnagiri |
|
|
|
|
|
|
|
|
|
|
|
|
|
|
268.82 |
149.12 |
24.59 |
95.11 |
|
|
Cluster 13 |
IchambadiAnicut Left main canal LS 0 km to 16.50 km |
|
|
|
Agharagaram |
Morappur |
Dharmapuri |
547.8 |
355.12 |
51.54 |
141.14 |
|
|
|
IchambadiAnicut Left main canal LS 16.50 km to 26.15 km |
|
|
|
Periyakottapallam, |
Uthangarai |
Krishnagiri |
|
|
|
|
|
|
|
|
|
|
|
Pachanampatti |
Uthangarai |
Krishnagiri |
|
|
|
|
|
|
|
|
|
|
|
Sorrakapatti, |
Uthangarai |
Krishnagiri |
|
|
|
|
|
|
|
|
|
|
|
Vellalapatti, |
Uthangarai |
Krishnagiri |
|
|
|
|
|
|
|
|
|
|
|
Velampatti |
Uthangarai |
Krishnagiri |
|
|
|
|
|
|
|
|
|
|
|
Mettuthangal, |
Uthangarai |
Krishnagiri |
|
|
|
|
|
|
|
|
|
|
|
Gollapatti, |
Uthangarai |
Krishnagiri |
|
|
|
|
|
|
|
|
|
|
|
Santharapatti, |
Uthangarai |
Krishnagiri |
|
|
|
|
|
|
|
|
|
|
|
Kattusingrapatti |
Uthangarai |
Krishnagiri |
|
|
|
|
|
|
|
|
|
|
|
Perumalnaickanpatti |
Uthangarai |
Krishnagiri |
|
|
|
|
|
|
|
|
|
|
|
Umyangoundanpatti, |
Uthangarai |
Krishnagiri |
|
|
|
|
|
|
|
|
|
|
|
Vedapatti, |
Uthangarai |
Krishnagiri |
|
|
|
|
|
|
|
|
|
|
|
Senaganpatti |
Uthangarai |
Krishnagiri |
|
|
|
|
|
|
|
|
|
|
|
Gidanpatti |
Uthangarai |
Krishnagiri |
|
|
|
|
|
|
|
|
|
|
|
konalpatti, |
Uthangarai |
Krishnagiri |
|
|
|
|
|
|
|
|
|
|
|
Murukanthal |
Uthangarai |
Krishnagiri |
|
|
|
|
|
|
|
|
|
|
|
|
|
|
767.46 |
491.37 |
76.98 |
199.11 |
|
|
Cluster 14 |
IchambadiAnicut Right main canal LS 0 km to 15.70 km |
|
|
|
Ichampadi, |
Morappur |
Dharmapuri |
|
|
|
|
|
|
|
|
|
, , |
|
Agharagaram, |
Morappur |
Dharmapuri |
|
|
|
|
|
|
|
|
|
|
|
Gattupatti |
Morappur |
Dharmapuri |
|
|
|
|
|
|
|
|
|
|
|
Semandahalli, |
Morappur |
Dharmapuri |
|
|
|
|
|
|
|
|
|
|
|
Elalvadai |
Morappur |
Dharmapuri |
|
|
|
|
|
|
|
|
|
|
|
Palaiyam, |
Morappur |
Dharmapuri |
|
|
|
|
|
|
|
|
|
|
|
Pallipatti, |
Morappur |
Dharmapuri |
|
|
|
|
|
|
|
|
|
|
|
Kattampatti, |
Morappur |
Dharmapuri |
|
|
|
|
|
|
|
|
|
|
|
Velampatti |
Morappur |
Dharmapuri |
|
|
|
|
|
|
|
|
|
|
|
Singeripatti. |
Morappur |
Dharmapuri |
|
|
|
|
|
|
|
|
|
|
|
|
|
|
586.67 |
408.18 |
46.97 |
131.52 |
|
|
|
IchambadiAnicut Right main canal LS 15.70 km to 30.30 km |
|
|
|
Vananpatti |
Uthangarai |
Krishnagiri |
|
|
|
|
|
|
|
|
|
|
|
Kattanur |
Uthangarai |
Krishnagiri |
|
|
|
|
|
|
|
|
|
|
|
Veeranamkuppam |
Uthangarai |
Krishnagiri |
|
|
|
|
|
|
|
|
|
|
|
Kathirampatti. |
Uthangarai |
Krishnagiri |
|
|
|
|
|
|
|
|
|
|
|
|
|
|
627.42 |
352.67 |
95.53 |
179.22 |
|
|
|
KumarampattiAnicut |
|
|
|
Kumarampatti |
Harur |
Dharmapuri |
|
|
|
|
|
|
|
|
|
|
|
Pappanavalasai |
Harur |
Dharmapuri |
|
|
|
|
|
|
|
|
|
|
|
Ettlapatti. |
Harur |
Dharmapuri |
|
|
|
|
|
|
|
|
|
|
|
|
|
|
46.96 |
22.01 |
16.56 |
8.39 |
|
|
|
Sub Total III |
|
|
|
|
|
|
2845.13 |
1778.47 |
312.17 |
754.49 |
|
|
|
|
|
|
|
|
|
|
|
|
|
|
|
|
I |
Sub total for system tanks |
|
|
|
|
|
|
2356.890 |
1451.18 |
284.26 |
621.45 |
|
|
II |
Sub total for supply channels |
|
|
|
|
|
|
3195.34 |
1685.50 |
547.53 |
962.305 |
|
|
III |
Sub total for anicuts |
|
|
|
|
|
|
2845.13 |
1778.47 |
312.17 |
754.49 |
|
|
|
Grand total |
|
|
|
|
|
|
8397.36 |
4915.15 |
1143.9 |
2338.2 |
|
2.4 Details of walk through survey-Krishnagiri to Pambar Sub Basin
The officials of all the line departments participated in the walk through survey as per the programme (in the below Table).
| Sl. No |
Date of visit |
Name of the village visited |
No. of farmers participated in awareness programme |
No. of farmers participated in walk through survey |
| 1. |
22.05.2016 |
Sundekuppam |
25 |
15 |
| 2. |
22.05.2016 |
Periyamuthur |
19 |
13 |
| 3. |
22.05.2016 |
Thimmapuram |
16 |
16 |
| 4. |
23.05.2016 |
Chowttalli |
28 |
18 |
| 5. |
23.05.2016 |
Thalihalli |
17 |
17 |
| 6. |
23.05.2016 |
Marichettihalli |
19 |
20 |
| 7. |
23.05.2016 |
Gundalapatti |
25 |
17 |
| 8. |
23.05.2016 |
Mittahalli |
24 |
16 |
| 9. |
24.05.2016 |
Santhapuram |
11 |
14 |
| 10. |
24.05.2016 |
Errahalli |
14 |
10 |
| 11. |
24.05.2016 |
Penashwaramadam |
16 |
12 |
| 12. |
21.06.2016 |
Jagadhap |
23 |
15 |
| 13. |
21.06.2016 |
Paiyur |
25 |
20 |
| 14. |
21.06.2016 |
Pannanthur |
10 |
15 |
| 15. |
21.06.2016 |
Vadmangalam |
12 |
15 |
| 16. |
21.06.2016 |
Barur |
20 |
20 |
| 17. |
21.06.2016 |
Bendarahalli |
18 |
15 |
| 18. |
21.06.2016 |
Kottapatti |
13 |
19 |
| 19. |
22.06.2016 |
Nedungal |
16 |
15 |
| 20. |
22.06.2016 |
A.Mottur |
11 |
11 |
| 21. |
22.06.2016 |
Kudimenahalli |
15 |
14 |
| 22. |
22.06.2016 |
Maruderi |
13 |
13 |
| 23. |
22.06.2016 |
Vilangamudi |
11 |
11 |
| 24. |
22.06.2016 |
Pachanampatti |
21 |
18 |
| 25. |
22.06.2016 |
Vellalapatti |
15 |
16 |
| 26. |
22.06.2016 |
Umyangoundanpatti |
22 |
21 |
| 27. |
22.06.2016 |
Vedapatti |
19 |
25 |
| 28. |
23.06.2016 |
Khambadi |
28 |
21 |
| 29. |
23.06.2016 |
Kumarampatti |
15 |
22 |
| 30. |
23.06.2016 |
Veeranakuppam |
19 |
11 |
| 31. |
23.06.2016 |
Marukanthal |
20 |
15 |
The following observations were made during the survey.
- Restoration of the ayacut area
- Removal of the encroachments
- Desilting and deepening of the tanks
- Strengthening of the existing bunds
- Repair works in the shutters
- The soil type is red loam, black loam, sandy loam, clayey and swampy
- Major agricultural crops cultivated are Paddy, Sugarcane, Pulses, Groundnut and horticultural crops like mango, tomato, brinjal, chillies are grown
- More emphasis on livestock management.
2.5 Cropping Pattern (Consolidated)
| Name of the sub Basin |
: KrishnagiritoPambar |
|
Fully Irrigated |
: |
4915.16 ha |
| Nodal District |
: Krishnagiri |
|
Partially Irrigated |
: |
1143.96 ha |
| Districts Covered |
: Krishnagiri&Dharmapuri |
|
Gap |
: |
2338.25 ha |
|
|
|
Total Ayacut Area |
: |
8397.36 ha |
|
|
|
Registered Ayacut Area |
: |
8397.36 ha |
| S.No |
Crop |
Without Project |
With Project |
Increasing |
| FI |
PI |
RF/G |
Total |
FI |
PI |
RF/G |
Total |
| I |
Perennial crop |
|
|
|
|
|
|
|
|
|
| 1 |
Coconut |
588 |
401 |
0 |
989 |
989 |
0 |
0 |
989 |
0 |
| 2 |
Mango |
7 |
23 |
38 |
68 |
68 |
0 |
0 |
68 |
0 |
| 3 |
Guava |
3 |
7 |
0 |
10 |
10 |
0 |
0 |
10 |
0 |
| 4 |
Cashew |
0 |
0 |
0 |
0 |
0 |
0 |
0 |
0 |
0 |
| 5 |
Casurina |
0 |
0 |
0 |
0 |
0 |
0 |
0 |
0 |
0 |
| 6 |
Flowers\Tube Rose |
355 |
0 |
0 |
355 |
380 |
0 |
0 |
380 |
25 |
| 7 |
Fodder |
0 |
0 |
0 |
0 |
0 |
0 |
0 |
0 |
0 |
|
Total |
953 |
431 |
38 |
1422 |
1447 |
0 |
0 |
1447 |
25 |
| II |
Annual Crop |
|
|
|
0 |
|
|
|
0 |
0 |
| 1 |
Sugarcane |
141 |
0 |
0 |
141 |
165 |
0 |
0 |
165 |
24 |
| 2 |
Banana |
24 |
0 |
0 |
24 |
24 |
0 |
0 |
24 |
0 |
| 3 |
T.C. Banana |
24 |
2 |
0 |
26 |
31 |
0 |
0 |
31 |
5 |
|
Total |
189 |
2 |
0 |
191 |
220 |
0 |
0 |
220 |
29 |
| III |
1st crop |
|
|
|
|
|
|
|
|
|
| 1. a |
Paddy |
2961 |
0 |
0 |
2961 |
0 |
0 |
0 |
0 |
-2961 |
| b |
Paddy - SRI |
323 |
0 |
0 |
323 |
3284 |
0 |
0 |
3284 |
2961 |
| 2 |
Maize |
53 |
21 |
0 |
74 |
305 |
0 |
0 |
305 |
231 |
| 3 |
Ragi |
49 |
3 |
13 |
65 |
188 |
0 |
0 |
188 |
123 |
| 4 |
Minor Millets |
27 |
0 |
11 |
38 |
200 |
0 |
0 |
200 |
162 |
| 5 |
Black gram |
30 |
51 |
42 |
123 |
105 |
0 |
0 |
105 |
-18 |
| 6 |
Green Gram |
10 |
25 |
40 |
75 |
85 |
0 |
0 |
85 |
10 |
| 7 |
Red Gram |
0 |
30 |
0 |
30 |
130 |
0 |
0 |
130 |
100 |
| 8 |
Horse Gram |
0 |
0 |
0 |
0 |
0 |
0 |
0 |
0 |
0 |
| 9 |
Other Pulses |
0 |
32 |
0 |
32 |
72 |
0 |
0 |
72 |
40 |
| 10 |
Groundnut |
63 |
248 |
78 |
389 |
403 |
0 |
0 |
403 |
14 |
| 11 |
Tomato |
163 |
0 |
2 |
165 |
181 |
0 |
0 |
181 |
16 |
| 12 |
Bhendi |
17 |
0 |
0 |
17 |
29 |
0 |
0 |
29 |
12 |
| 13 |
Brinjal |
35 |
0 |
0 |
35 |
45 |
0 |
0 |
45 |
10 |
| 14 |
Gourds |
2 |
0 |
0 |
2 |
0 |
0 |
0 |
0 |
-2 |
| 15 |
Radish |
5 |
0 |
0 |
5 |
14 |
0 |
0 |
14 |
9 |
| 16 |
Chillies |
35 |
0 |
0 |
35 |
63 |
0 |
0 |
63 |
28 |
| 17 |
Beans |
0 |
0 |
0 |
0 |
0 |
0 |
0 |
0 |
0 |
| 18 |
Veg Cowpea |
0 |
53 |
0 |
53 |
62 |
0 |
0 |
62 |
9 |
| 19 |
Corinader |
0 |
0 |
0 |
0 |
0 |
0 |
0 |
0 |
0 |
| 20 |
Crossandra |
0 |
0 |
0 |
0 |
0 |
0 |
0 |
0 |
0 |
| 21 |
Fodder Cholam |
0 |
248 |
52 |
300 |
224 |
0 |
0 |
224 |
-76 |
| 22 |
Fallow |
0 |
0 |
2062 |
2062 |
0 |
0 |
1340 |
1340 |
-722 |
|
Total |
3773 |
711 |
2300 |
6784 |
5390 |
0 |
1340 |
6730 |
-55 |
|
Grand Total (I+II+III) |
4915 |
1144 |
2338 |
8397 |
7057 |
0 |
1340 |
8397 |
-1 |
| IV |
2 nd crop |
|
|
|
0 |
|
|
|
0 |
0 |
| 1. a |
Paddy |
555 |
0 |
0 |
555 |
0 |
0 |
0 |
0 |
-555 |
| b |
Paddy - SRI |
152 |
0 |
0 |
152 |
894 |
0 |
0 |
894 |
742 |
| 2 |
Maize |
54 |
0 |
0 |
54 |
195 |
0 |
0 |
195 |
141 |
| 3 |
Pulses |
22 |
4 |
32 |
58 |
270 |
0 |
0 |
270 |
212 |
| 4 |
Groundnut |
35 |
1 |
29 |
65 |
216 |
0 |
0 |
216 |
151 |
| 5 |
Bhendi |
21 |
0 |
0 |
21 |
21 |
0 |
0 |
21 |
0 |
|
Total |
839 |
5 |
61 |
905 |
1596 |
0 |
0 |
1596 |
691 |
| V |
3rd crop |
|
|
|
0 |
|
|
|
0 |
0 |
| 1. a |
Paddy |
0 |
10 |
0 |
10 |
0 |
0 |
0 |
0 |
-10 |
| b |
Paddy - SRI |
0 |
25 |
0 |
25 |
175 |
0 |
0 |
175 |
150 |
| 2 |
Pulses |
0 |
0 |
0 |
0 |
422 |
0 |
0 |
422 |
422 |
| 3 |
Groundnut |
15 |
0 |
0 |
15 |
415 |
0 |
0 |
415 |
400 |
|
Total |
15 |
35 |
0 |
50 |
1012 |
0 |
0 |
1012 |
962 |
|
Great Grand Total |
5769 |
1184 |
2399 |
9352 |
9665 |
0 |
1340 |
11005 |
1653 |
|
Cropping Intensity |
|
|
|
111.37 |
|
|
|
131.06 |
|
2.5.1 Adaptive Research Interventions
- Adopting water saving technologies like SRI and drip/ Micro irrigation method in crop production
- Emphasizing for balanced application of inputs through soil testing and crop requirements
- Implementing crop intensification with better management of all the inputs
- Diversification with less water requiring and more income generating crops
2.5.2. Introduction of labour saving implements.
- Using cono weeder in SRI
- Using chisel plough for sub soil hard pan breaking
- Promoting the use of rotavator for pulverizing the soil into fine tilth
- Promoting the use of broad bed furrow former for wide spaced annual crops
2.5.3. Plan for crop diversification, crop introduction and crop intensification.
- Diversification- Cultivating flowers and vegetables in the place of paddy or in the gap area Intensification
- Promoting System of Rice Intensification
- Promoting pulses and oil seeds in the gap area for more income with less water
2.5.4. Plan for introducing non-monetary inputs to increase the productivity.
- Promoting the use of labeled seeds for sowing
- Emphasizing soil test based nutrition
- Recommending temporal cultivation practices
- Demonstrating integrated pest, disease and weed management practices
- Equipping for clean harvest and grading procedures for fetching higher income
2.5.5. Soil type
Soil type varies from sandy to sandy loam, clay and clayey loam which can be grouped under inceptisol, alfisol and vertisol.
3. Field interventions
3.1. Productivity enhancement in Rice
In ayacut area rice is being grown over an area of 4353 ha and contributed 12.77 per cent of total cropped area. The major paddy varieties namely ADT-39, Paiyur-1 and white Ponni and BPT-5204 and other private strains are grown in the Krishnagiri to Pambar sub basin. The average productivity of rice is 3905 kg ha-1 as against 5800 kg ha-1 of state average and yield gap of 1895 t ha-1 and the wider yield gap due to poor soil nutrient status coupled with non-adoption of high yielding varieties and improved technologies. Most of the rice growing soils are suffering from Phosphorus and zinc deficiency and resulted poor establishment and lower yield. Planting in season become difficult due to non-availability of farm labour. By considering all above, the technologies viz., Green Manuring, adoption of SRI, mechanical transplanting, alternate wetting and drying (AWD), zinc application, mechanical weeding and adoption of IPDM practice will pave the way for increasing the productivity and profitability of the farming community. Supply of seeds of improved varieties, supply of balanced nutrients, and bio agents for soil and plant health management will be done for aforesaid intervention.
| S.No. |
Technology |
Total area (ha) |
Unit cost (Rs.) |
Total cost(in lakhs) |
| 1 |
GM-SRI |
40 |
8000 |
3.20 |
| 2 |
SRI |
60 |
6000 |
3.60 |
Details of unit cost for Green manure
| S. No. |
Particulars |
Amount (Rs.) |
| 1. |
Seed cost 40 kg/ha @ Rs. 50/kg |
2000.00 |
|
Grand Total |
2000.00 |
Details of unit cost for SRI
| S. No |
Particulars |
Amount(Rs.) |
| 1 |
Cost of Soil testing |
20.00 |
| 2 |
Seed cost - 10 kg / ha @ Rs.30/kg |
300.00 |
| 3 |
Cost of nursery raising |
- |
| 4 |
Cost of fertilizers (150:50:50 Kg NPK / ha) |
|
Urea - 300 kg/ha @ Rs.6 /kg |
1,800.00 |
|
Muriate of Potash – 80 kg @ Rs.16/kg |
1,280.00 |
|
ZnSO4 25 kg @ Rs.40/kg |
1,000.00 |
| 5 |
Bio fertilizer & Bio inoculants |
1,600.00 |
|
Grand Total |
6,000.00 |
3.2. Production of TFL Seeds under farmer’s participatory approach to produce quality pulse seeds
In Krishnagiri district, pulses are grown in an area of 36,000 ha concentrating mostly on the six blocks located at the Pambar sub basin. The farmers are widely using the variety of the ancestral sequence and their own seed or the seeds supplied by local merchants.
| S.No. |
Technology |
Total area (ha) |
Unit cost (Rs.) |
Total cost(in lakhs) |
| 1 |
Improving the farm income through quality seed production (TFL) in pulses |
58 |
6000 |
3.48 |
Details of Unit cost for TFL Pulse
| S. No |
Particulars |
Amount (Rs.) |
| 1. |
Cost of Soil testing |
20.00 |
| 2. |
Seed cost with seed treatment - 20 kg / ha @ Rs.150/kg |
3,000.00 |
| 3. |
DAP 25 kg / ha @ Rs.22.50/kg |
560.00 |
| 4. |
Pulse Wonder 2 kg/ha @ Rs.220/kg |
440.00 |
| 5. |
Cleaning and Packaging of seeds |
1,000.00 |
| 6. |
Bio fertilizers and Bio inoculants |
980.00 |
|
Grand Total |
6,000.00 |
3.3 Area Enhancement, Area Expansion and productivity enhancement of pulses under crop diversification in gap area
With a decreasing area under cultivation, the possibility to improve the production of pulses through the adoption of high yielding and resistant varieties with improved packages of practices. Being a short duration crop, more crops will be accommodated instead of growing long duration crops so that annual productivity of gap area can be enhanced positively in the sub basin.
| S.No. |
Technology |
Total area (ha) |
Unit cost (Rs.) |
Total cost(in lakhs) |
| 1 |
Area Expansion in Pulses |
48 |
5000 |
2.40 |
Details of Unit cost for Area expansion Pulse
| S. No |
Particulars |
Amount (Rs.) |
| 1. |
Cost of Soil testing |
20.00 |
| 2. |
Seed cost with seed treatment - 20 kg / ha @ Rs.150/kg |
3,000.00 |
| 3. |
DAP 25 kg / ha @ Rs.22.50/kg |
560.00 |
| 4. |
Pulse Wonder 2 kg/ha @ Rs.220/kg |
440.00 |
| 5. |
Bio fertilizers and Bio inoculants |
980.00 |
|
Grand Total |
5,000.00 |
Demonstration of improved production techniques with various oil seed crops with prime focus on improving productivity and encouraging crop diversification
Groundnut is traditionally cultivated in the district under irrigated and rainfed conditions. The area under rainfed cultivation is almost three times the area under irrigated groundnut cultivation. Improved crop production technologies viz., seed drill sowing to optimize the plant density per unit area, split application gypsum to facilitate peg penetration and micronutrient spray to reduce the pop pods are some key technologies in enhancing the productivity of groundnut and demonstration along with INM and IPDM practices in gap area will boost the economic status of farming community of the sub basin area.
| S.No. |
Technology |
Total area (ha) |
Unit cost (Rs.) |
Total cost(in lakhs) |
| 1 |
Improved production technology with oil seed crops |
10 |
5000 |
0.50 |
Details of Unit cost for Oil seeds
| S. No |
Particulars |
Amount(Rs.) |
| 1. |
Cost of Soil testing |
20.00 |
| 2. |
Gypsum 400 Kg / ha @Rs.5/Kg |
2,000.00 |
| 3. |
Fertilizer cost |
1,500.00 |
| 4. |
Pheromone trap and lure for Spodoptera litura |
730.00 |
| 5. |
Micro nutrient spray (DAP–2.5 Kg, Ammonium sulphate – 1 Kg, Borax – 500 gm and planofix–375 Ml) @ Rs.250 for 3 sprays. |
750.00 |
|
Grand Total |
5,000.00 |
3.5 Sustainable Sugarcane Initiative (SSI) in sub basin under Precision farming approach
Sugarcane is one of the commercial crops with higher water requirement of 2000-2500mm. Unlike surface method of irrigation, the water use efficiency is extremely higher in drip method of irrigation, as this technology helps to supply the required quantity of irrigation water directly to the root zone besides reducing conveyance evaporation and distribution losses. The Sustainable Sugarcane Initiative (SSI) aims at providing practical options to farmers in improving the productivity of land, water and labour, all at the same time. In addition, it reduces crop duration and provides factories a much longer period of crushing season and hence increasing employment to a longer period of time. SSI is also expected to reduce the overall pressure on water resources and contribute to recovery of ecosystems.
| S.No. |
Technology |
Total area (ha) |
Unit cost (Rs.) |
Total cost(in lakhs) |
| 1 |
Sustainable Sugarcane Initiative (SSI) |
20 |
1,00,000 |
20.00 |
Details of Unit cost for Precision Farming in Sugarcane
| S. No |
Particulars |
Amount (Rs.) |
| 1. |
Drip cost as per the Govt. norms @ 75% subsidy |
64,200.00 |
| 2. |
Cost of Seedlings/ha (15000 Nos/ha) @ Rs.1.5 |
22,500.00 |
| 3. |
Water Soluble fertilizers. |
|
12:61:00 – 100 kg @ Rs.100/kg |
10,000.00 |
|
00:00:50 – 225 kg @ Rs.75/kg |
| 4. |
Bio Fertilizers & Bio pesticide |
1,550.00 |
| 5. |
Sugarcane booster 5 Kg/ha @ Rs.350/kg |
1,750.00 |
|
Grand Total |
1,00,000.00 |
3.6. Precision farming in Vegetables in sub-basins through climate resilience activity in model Bio Villages known as pesticide free Village
Precision farming involves looking at the increased efficiency that can be realized by understanding and dealing with the natural variability found within a field. The goal is not to obtain the same yield everywhere, but rather to manage and distribute inputs on a sites specific basis to maximize long term cost or benefit. Precision farming is a farming system concept which involves the development and adoption of knowledge based technical management systems with the main goal of optimizing profit. Supply of seedlings, Supply of drip materials, Supply of water soluble fertilizer, Supply of bio inoculants, Supply of Bio pesticides chemical will be more supportive for implementation of the programme in sub basin gap area
| S.No. |
Technology |
Total area (ha) |
Unit cost (Rs.) |
Total cost(in lakhs) |
| 1 |
Precision farming in Vegetables |
25 |
120000 |
30.00 |
Details of Unit cost for Precision Farming in Vegetables
| S. No |
Particulars |
Amount (Rs.) |
| 1. |
Drip cost as per the Govt. norms @ 75 % subsidy |
75,000.00 |
| 2. |
Cost of Seed/Seedlings |
25,000.00 |
| 3. |
Water Soluble fertilizers |
|
|
19:19:19-100 kg @ Rs.75/kg |
7,500.00 |
|
Urea - 200 kg @ Rs.6/kg |
- |
|
MAP-50 kg @ Rs.90/kg |
4,500.00 |
|
SSP-100kg @ Rs.7.5/kg |
750.00 |
| 4. |
Bio fertilizer |
1,750.00 |
| 5. |
Mulching sheets & Laying |
5,500.00 |
|
Grand Total |
1,20,000.00 |
3.7. Improving productivity of Toor Dhal (Red Gram) under Precision farming techniques including IPM approach
In Krishnagiri district red gram is being grown in an area 2256 ha and accounted for production of 2864 tonnes. The average productivity is 500 kg ha-1 and found lower then national average of 659 kg ha-1 and the yield gap was 300 kg ha-1 as compared with potential yield. The main reason for poor yield is due to poor crop stand, water scarcity non-adoption of improved technologies. Transplanting technique one of the most promising technology for higher productivity and would be helpful for better crop stand in delayed monsoon. In addition to above incident of sucking pest and pod borer reduced yield, the prevalence of existing damage causes physiological disorder and thereby flower reduction. Hence, supply of IPM kit and growth promoting substances would enable red gram grower for increasing the productivity and profitability. This is being practiced in the existing vegetables area as a follow on crop. Supply of seedlings, Supply of drip materials, Supply of water soluble fertilizer, Supply of foliar spray of 2% DAP or 1% pulse wonder, Supply of bio inoculants will pave the way to demonstrate the new technology as detailed below
| S.No. |
Technology |
Total area (ha) |
Unit cost (Rs.) |
Total cost(in lakhs) |
| 1. |
Promotion of Red gram (Toor Dhal) under cropping sequences in vegetables |
10 |
10000 |
1.00 |
| 2. |
Improving productivity of Toor Dhal under precision farming techniques including IPM approaches |
25 |
100000 |
25.00 |
Details of Unit cost for Redgram (Toor Dhal) under cropping sequence in vegetables
| S. No |
Particulars |
Amount (Rs.) |
| 1. |
Cost of Seedlings |
10,000.00 |
|
Grand Total |
10,000.00 |
Details of Unit cost for Precision Farming in Red gram
| S. No |
Particulars |
Amount (Rs.) |
| 1. |
Drip cost as per the Govt. norms @ 75% Subsidy |
64,200.00 |
| 2. |
Cost of Seedlings and Transplanting |
18,000.00 |
| 3. |
Water Soluble fertilizers |
|
|
Urea - 200 kg @ Rs.6/kg |
1,200.00 |
|
MAP-100 kg @ Rs.90/kg |
9,000.00 |
|
SOP- 50 kg @ Rs.75/kg |
3,750.00 |
| 3. |
Pulse Wonder 2 kg/ha @ Rs.220/kg |
440.00 |
| 4. |
Bio fertilizer & Bio Pesticide |
2,000.00 |
| 5. |
Organic Manures viz. Vermicompost |
1,410.00 |
|
Grand Total |
1,00,000.00 |
3.8. Introduction of new technologies in fruit crops by demonstrating TNAU High density
Planting with drip fertigation in Mango/Pomegranate etc.,
Mango (Mangifera indica L.) is one of the high potential fruit crops in India. Even though mango has been grown in India for around 4000 years with the highest area, the yield is low comparing other countries. One of the main reasons for low productivity of mango (7.0t/ha) in India is the adoption of low density population per unit area as the trees were planted at wider spacing in earlier years such as 10-12m on either way. Water and nutrients are two important inputs which need constant supply to the yielding trees for better productivity compiled with quality fruits. But, in practice, most of the mango growers are not taking care of these inputs and the trees are left to nature for water and nutrient thereby the state average productivity (4.3 t/ha) remaining low against the national productivity (7.1 t/ha) apart 75% of the mango area under in rainfed condition. The drip irrigation system is a boon to perennial crop particularly fruit crops, by which both the nutrient and water can be given in sustainable manner. The water requirement has been standardized for various stages of growth period. By the technology of fertigation, the nutrient management can be easily done using water soluble fertilizers with the advantage of applying them in minimal quantities at required stages even by weekly doses. The fertigation schedule has to be standardized for various commercial varieties by which an average farmer can also easily manage a mango plantation in a scientific way. Although mangoes are conventionally planted at 10 x 10 m spacing, experiments conducted at various centers in India revealed that HDP with 10 x 5 x 5 m or 5 x 5 m accommodating more number of plants per hectare can considerably increase the yield.
Major yield under different planting densities
| S. No |
Type |
Spacing adopted(m) |
Population/ha |
Yield /ha (MT) |
| 1. |
Normal planting |
10 x 10 |
100 |
8-10 |
| 2. |
HDP –Hedge row |
10 x 5 x 5 |
265 |
10-15 |
| 3 |
HDP - Square |
5 x 5 |
400 |
15-20 |
Supply of seedlings, Supply of drip materials, Supply of water soluble fertilizer, Supply of bio inoculants, Supply of Bio pesticides
| S.No. |
Technology |
Total area (ha) |
Unit cost (Rs.) |
Total cost(in lakhs) |
| 1 |
High density planting with drip fertigation in Mango/Pomegranate |
15 |
75000 |
11.25 |
Details of Unit cost for Precision Farming in Mango under High Density Planting (HDP - 5m × 5m)
| S. No |
Particulars |
Amount (Rs.) |
| 1. |
Drip cost as per the Govt. norms @75% Subsidy |
26,000 |
| 2. |
Cost of Seed/Seedlings (400 Nos/ha) |
28,000 |
| 3. |
Water Soluble fertilizers (19:19:19, MAP, Urea) |
19,500 |
| 4. |
Bio inoculants & Bio fertilizers |
1,500 |
|
Grand Total |
75,000 |
Promotion of Pesticide Free vegetables in sub-basins through climate resilience activity in Pesticide Free Village
Tomato, Lycopersicum esculentum is the world’s largest vegetable crop, which occupies an outstanding place among the important vegetables of the world and commercially cultivated for its fleshy fruits. In India, productivity of tomato is very low as compared to its production potential of the developed countries. There are many reasons for low production potential and among them pest infestation is major one. Presently, chemical pesticides are preferably used by farmers for the protection of tomato fruits against leaf miner and other pests. The over dependence and indiscriminate use of chemical pesticides has resulted in several problems like Development of resistance to pesticides, outbreak of secondary pest, reduction of biodiversity and natural enemies. Indiscriminate use of pesticides resulted in failure of control of the tomato fruit borer (Lal and Lal, 1996). These drawbacks of chemical pesticides emphasized the need to identify alternate at the same time organic mode of production of vegetables.
| S.No. |
Technology |
No. of groups |
Unit cost (Rs.) |
Total cost(in lakhs) |
| 1 |
Promotion of pesticide free vegetable production and organic farming |
40 |
2,500 |
1.00 |
3.10. Formation of Pulse commodity groups
| S.No. |
Technology |
No. of groups |
Unit cost (Rs.) |
Total cost(in lakhs) |
| 1 |
Formation of Pulse commodity groups |
25 |
2,000 |
0.50 |
Farm Implements:
| S.No. |
Technology |
Quantity |
Unit cost (Rs.) |
Total cost(in lakhs) |
| 1 |
Conoweeder |
40 |
1,000 |
0.40 |
| 2 |
Field water tube |
180 |
250 |
0.45 |
4. IEC Measures (Information, Education and Communication)
4.1. Capacity building
4.1.1. Training to stakeholders
Under this activity, imparting training to all the beneficiaries either as off-campus or as on-campus is planned.
| Sl. No |
Particulars |
Duration (days) |
No/batch |
Total batch |
Budget / batch |
Total budget (lakhs) |
| 1. |
Improved production technology through SRI |
1 |
50 |
5 |
10,000 |
0.50 |
| 2. |
Quality seed production in Pulses |
1 |
50 |
5 |
10,000 |
0.50 |
| 3. |
Organic farming in vegetables. |
1 |
10 |
5 |
10,000 |
0.50 |
| 4. |
Precision farming redgram |
1 |
50 |
5 |
10,000 |
0.50 |
| 5. |
Precision farming vegetables |
1 |
50 |
5 |
10,000 |
0.50 |
| 6. |
Sustainable sugarcane initiative |
1 |
10 |
5 |
10,000 |
0.50 |
| 7. |
High density planting (HDP) for fruit crops |
1 |
50 |
10 |
10,000 |
1.00 |
|
|
|
|
|
Total |
4.00 |
4.1.2. Exposure visit
In-order to have practical knowledge on various improved farming practices prevailing across the District and State, it has been proposed to expose the stakeholders by organizing educational tours for having better cross learning.
4.2. IEC Activities (Information, Education and Communication)
4.2.1. Awareness creation
Organize awareness campaign
- Informal meetings with Farmers / Water Users Association through PRA methods – Focus group discussion and transect walk
- Ensure transparency
- Explain about the scheme – organization objectives, activities, project contribution and farmers share
- Emphasis the role of stake holders in the project
- Project the expected benefit
4.2.2. Documentation
- Maintenance of records and registers
- Field note for each activity
- Daily memorandum sheet
- Receipt and issue of inputs
- Technical observations on soil, water and crop
4.2.3. IEC Equipments
- Computer / laptop
- Camera
- Computer accessories
4.2.4. Out sourcing charges
Outsourcing of vehicle
- Expenditure on TA /DA for the purpose of TN-IAM Project
- Fuel bill of university vehicle utilized for the project
- Hire charges of university vehicle utilized for this purpose
5. Management cost
Outsourcing of technical staff
Outsourcing of technical staff is included in TNAU sub basin plan to carry out the field activities.
6. YEAR WISE ACTIVITIES
| S. No. |
Particulars |
Area (ha) |
Total (ha) |
| I |
II |
III |
IV |
V |
| 1. |
Green manure - SRI |
10 |
10 |
10 |
10 |
0 |
40 |
|
System of Rice Intensification |
15 |
15 |
15 |
15 |
0 |
60 |
| 2. |
TFL seed production on pulses |
10 |
15 |
18 |
15 |
0 |
58 |
| 3. |
Area expansion of pulses |
10 |
10 |
15 |
13 |
0 |
48 |
| 4. |
Oilseed cultivation with improved practices |
10 |
0 |
0 |
0 |
0 |
10 |
| 5. |
SSI under precision in sugarcane |
7 |
5 |
4 |
4 |
0 |
20 |
| 6. |
PF vegetables - IPM concept |
10 |
5 |
5 |
5 |
0 |
25 |
| 7. |
Redgram under cropping sequence in vegetables |
10 |
0 |
0 |
0 |
0 |
10 |
| 8. |
PF Redgram - IPM Approach |
10 |
5 |
5 |
5 |
0 |
25 |
| 9. |
HDP Mango/Pomegranate - MI |
5 |
5 |
5 |
0 |
0 |
15 |
|
Total |
97 |
70 |
77 |
67 |
0 |
311 |
Year wise budget for Krishnagiri to Pambar Sub Basin (in Lakhs) Table in Portrait format
P –Physical in ha F – Financial in lakhs
| S. No |
Particulars |
Unit cost Rs/ha |
I Year |
II Year |
III Year |
IV Year |
V Year |
VI Year |
Total |
| A |
A.Field interventions |
P |
F |
P |
F |
P |
F |
P |
F |
P |
F |
P |
F |
P |
F |
| 1 |
GM-SRI |
8000 |
10 |
0.80 |
10 |
0.80 |
10 |
0.80 |
10 |
0.80 |
0 |
0.00 |
0 |
0.00 |
40 |
3.20 |
|
SRI |
6000 |
15 |
0.90 |
15 |
0.90 |
15 |
0.90 |
15 |
0.90 |
0 |
0.00 |
0 |
0.00 |
60 |
3.60 |
| 2 |
Pulse seed production programme : Production of TFL Seeds under farmers participatory approach to produce quality pulse seeds |
6000 |
10 |
0.60 |
15 |
0.90 |
18 |
1.08 |
15 |
0.90 |
0 |
0.00 |
0 |
0.00 |
58 |
3.48 |
| 3 |
Area Enhancement, Area Expansion and productivity enhancement of pulses under crop diversification in gap areas: |
5000 |
10 |
0.50 |
10 |
0.50 |
15 |
0.75 |
13 |
0.65 |
0 |
0.00 |
0 |
0.00 |
48 |
2.40 |
| 4 |
Demonstration of improved production techniques with various oil seed crops with prime focus on improving productivity, encouraging crop diversification |
5000 |
10 |
0.50 |
0 |
0.00 |
0 |
0.00 |
0 |
0.00 |
0 |
0.00 |
0 |
0.00 |
10 |
0.50 |
| 5 |
Promotion of sustainable Sugarcane Initiative (SSI) in sub basin under precision farming approach. |
100000 |
7 |
7.00 |
5 |
5.00 |
4 |
4.00 |
4 |
4.00 |
0 |
0.00 |
0 |
0.00 |
20 |
20.00 |
|
SSI Ratoon |
|
|
0.00 |
7 |
0.00 |
5 |
0.00 |
4 |
0.00 |
3 |
0.00 |
0 |
0.00 |
19 |
0.00 |
| 6 |
Production of vegetable under precision farming mode by adopting of IPM concept. |
120000 |
10 |
12.00 |
5 |
6.00 |
5 |
6.00 |
5 |
6.00 |
0 |
0.00 |
0 |
0.00 |
25 |
30.00 |
| 7 |
Promotion of Red Gram (Toor Dhal) under cropping sequence in vegetables |
10000 |
10 |
1.00 |
0 |
0.00 |
0 |
0.00 |
0 |
0.00 |
0 |
0.00 |
0 |
0.00 |
10 |
1.00 |
| 8 |
Improving productivity of Toor Dhal (Red Gram) under precision farming techniques including IPM approach |
100000 |
10 |
10.00 |
5 |
5.00 |
5 |
5.00 |
5 |
5.00 |
0 |
0.00 |
0 |
0.00 |
25 |
25.00 |
| 9 |
Introduction of new technologies in fruit crops by demonstrating TNAU High density planting with drip fertigation in Mango/Pomegranate etc., |
75000 |
5 |
3.75 |
5 |
3.75 |
5 |
3.75 |
0 |
0.00 |
0 |
0.00 |
0 |
0.00 |
15 |
11.25 |
| 10 |
Formation of Pulse commodity groups and federated to FPO (Seed to sales) and later linking with the Marketing Dept. |
2000 |
5 |
0.10 |
5 |
0.10 |
5 |
0.10 |
5 |
0.10 |
5 |
0.10 |
0 |
0.00 |
25 |
0.50 |
| 11 |
Promotion of Pesticide Free vegetables in sub-basins through climate resilience activity in model Bio Villages known as pesticide free Village. |
2500 |
10 |
0.25 |
10 |
0.25 |
10 |
0.25 |
5 |
0.13 |
5 |
0.13 |
0 |
0.00 |
40 |
1.00 |
|
Total |
|
112 |
37.40 |
92 |
23.20 |
97 |
22.63 |
81 |
18.48 |
13 |
0.23 |
0 |
0 |
395 |
101.93 |
|
B.Implements for farm mechanization |
|
|
|
|
|
|
|
|
|
|
|
|
|
|
|
| 1 |
Cono weeder |
1000 |
10 |
0.10 |
10 |
0.10 |
10 |
0.10 |
10 |
0.10 |
0 |
0.00 |
0 |
0.00 |
40 |
0.40 |
| 2 |
Field water tube (Pani pipe) |
250 |
45 |
0.11 |
45 |
0.11 |
45 |
0.11 |
45 |
0.11 |
0 |
0.00 |
0 |
0.00 |
180 |
0.45 |
|
Total |
|
55 |
0.21 |
55 |
0.21 |
55 |
0.21 |
55 |
0.21 |
0 |
0.00 |
0 |
0.00 |
220 |
0.85 |
|
Sub Total (A+B) |
|
167 |
37.61 |
147 |
23.41 |
152 |
22.84 |
136 |
18.69 |
13 |
0.23 |
0 |
0.00 |
615 |
102.78 |
| II |
IEC & CB |
|
|
|
|
|
|
|
|
|
|
|
|
|
|
|
| 1 |
Capacity Building |
|
|
|
|
|
|
|
|
|
|
|
|
|
|
|
|
a. Training to Stakeholders |
|
|
1.00 |
|
1.00 |
|
1.00 |
|
0.50 |
|
0.50 |
|
0.00 |
|
4.00 |
|
b. Exposure visit |
|
|
0.50 |
|
0.25 |
|
0.25 |
|
0.25 |
|
0.25 |
|
0.00 |
|
1.50 |
| 2 |
IEC |
|
|
|
|
|
|
|
|
|
|
|
|
|
|
|
|
a. Awareness creation |
|
|
0.50 |
|
0.50 |
|
0.50 |
|
0.25 |
|
0.10 |
|
0.00 |
|
1.85 |
|
b.Documentation |
|
|
0.40 |
|
0.40 |
|
0.40 |
|
0.10 |
|
0.10 |
|
0.25 |
|
1.65 |
|
c.IEC equipments |
|
|
0.75 |
|
0.00 |
|
0.00 |
|
0.00 |
|
0.00 |
|
0.00 |
|
0.75 |
|
d.Out sourcing charges on vehicles |
|
|
0.65 |
|
0.65 |
|
0.65 |
|
0.65 |
|
0.65 |
|
0.25 |
|
3.50 |
|
Total |
|
|
3.80 |
|
2.80 |
|
2.80 |
|
1.75 |
|
1.60 |
|
0.50 |
|
13.25 |
| III |
Management cost |
|
|
|
|
|
|
|
|
|
|
|
|
|
|
|
| 1 |
Out sourcing of technical staff |
|
|
4.14 |
|
2.62 |
|
2.56 |
|
2.04 |
|
0.24 |
|
0.00 |
|
11.60 |
|
Overall Total |
|
|
45.55 |
|
28.83 |
|
28.20 |
|
22.48 |
|
2.07 |
|
0.50 |
|
127.63 |
8. Total budget for Krishnagiri to Pambar Sub Basin (in Lakhs)
| S.No |
Intervention details |
Unit cost Rs/ha |
P |
F |
| I |
A. Field Interventions |
|
|
|
| 1 |
Productivity enhancement in rice |
|
|
|
|
Green manure - SRI |
8000 |
40 |
3.20 |
|
System of Rice Intensification |
6000 |
60 |
3.60 |
| 2 |
Pulse seed production programme : Production of TFL Seeds under farmers participatory approach to produce quality pulse seeds |
6000 |
58 |
3.48 |
| 3 |
Area Enhancement, Area Expansion and productivity enhancement of pulses under crop diversification in gap areas: |
5000 |
48 |
2.40 |
| 4 |
Demonstration of improved production techniques with various oil seed crops with prime focus on improving productivity, encouraging crop diversification |
5000 |
10 |
0.50 |
| 5 |
Promotion of sustainable Sugarcane Initiative (SSI) in sub basin under precision farming approach. Scaling up SSI through joint venture with the nearby Sugar mills. |
100000 |
20 |
20.00 |
| 6 |
Production of vegetable under precision farming mode by adopting of IPM concept.(Cost inclusive of Sustainability and replication on the use of Water soluble fertilizers in the subsequent crops) |
120000 |
25 |
30.00 |
| 7 |
Promotion of Red Gram (Toor Dhal) under cropping sequence in vegetables |
10000 |
10 |
1.00 |
| 8 |
Improving productivity of Toor Dhal (Red Gram) under precision farming techniques including IPM approach |
100000 |
25 |
25.00 |
| 9 |
Introduction of new technologies in fruit crops by demonstrating TNAU High density planting with drip fertigation in Mango/Pomegranate etc., |
75000 |
15 |
11.25 |
| 10 |
Formation of Pulse commodity groups and federated to FPO (Seed to sales) and later linking with the Marketing Department |
2000 |
25 |
0.50 |
| 11 |
Promotion of Pesticide Free vegetables in sub-basins through climate resilience activity in model Bio Villages known as pesticide free Village |
2500 |
40 |
1.00 |
|
B. Implements for farm mechanization |
|
|
|
| 12 |
Conoweeder |
1000 |
40 |
0.40 |
| 13 |
Field water tube (Pani pipe) |
250 |
180 |
0.45 |
|
Sub Total (A+B) |
|
596 |
102.78 |
| II |
Information Education Communication (IEC) Measures &Capacity Building |
|
|
|
| 1 |
Capacity Building |
|
|
|
|
a. Training to stakeholders |
|
|
4.00 |
|
b. Exposure visit |
|
|
1.50 |
| 2 |
IEC |
|
|
|
|
a. Awareness |
|
|
1.85 |
|
b. Documentation |
|
|
1.65 |
|
c. IEC Equipments |
|
|
0.75 |
|
d. Outsourcing charges on vehicles |
|
|
3.50 |
|
Total |
|
|
13.25 |
| III |
Management cost |
|
|
|
| 1 |
Outsourcing of technical cost |
|
|
11.60 |
|
Total |
|
|
11.60 |
|
Over all total (I+II+III) |
|
|
127.63 |