1. Introduction
0.1 About the Centre
The Department of Agronomy, Agricultural College and Research Institute, Killikulam was started in the year 1985 under the administrative head of the Dean, Agricultural College and Research Institute, Killikulam. The Head of the Department of Agronomy is also the Unit officer for Crop Physiology unit. At present, this department has 4 teaching staff members in Agronomy unit and 2 teaching staff members in Crop Physiology unit. This department conducts courses for B.Sc. (Ag.) and M.Sc. (Ag.) in Agronomy degree programme. At present, there are 14 post graduate students in this Department.
Thrust area of the Department
- To develop agronomic strategies for effective mechanization in rice cultivatio
- Agronomic management packages to maximize the rice fallow pulses production under Tamiraparani command area.
- Strategic research for development of cost effective technologies for enhancing organic farming productivity.
- Development of management strategies to mitigate the climate change effect on rice production in Tamiraparani river basins areas.
- Evolving high productive cropping system for garden land under southern districts
- Evolving sustainable Agro-forestry and Alley cropping system model for dry tract of southern district and also evolving effective systems for wasteland development
- Development of management technologies for drought in pulses and rice
1.2. About the Sub basin
- Name of the sub basin : Lower Tamiraparani
- Districts : Tirunelveli& Thoothukudi
- WRO Region : Madurai
- Blocks Covered : Tirunelveli district
1. Cheranmahadevi
2. Manur
3. Nanguneri
4. Palayamkottai
5. Alangulam
6. Kalakadu
7. Pappakudi.
1. Karungulam
2. Srivaikundam
3. Alwarthirunagari
4. Sathankulam
2. Total Registered Ayacut Area of the sub basin
| District |
Fully irrigated (ha) |
Partially irrigated (ha) |
Gap(ha) |
Total ayacut (ha) |
| Tirunelveli |
7224.39 |
4194.47 |
2290.40 |
13709.26 |
| Thoothukudi |
2650.81 |
7041.89 |
1776.42 |
11469.12 |
| Total |
9875.2 |
11236.36 |
4066.82 |
25178.38 |
2.1. Block wise registered ayacut area in the sub-basin is furnished below. (Area in Ha)
| Sl.No |
Block |
No. of tanks& Direct anicut |
No. of direct anicuts |
Fully irrigated area |
Partially irrigated area |
Gap area |
Registered ayacut area |
| Cultivable gap |
Permanent gap |
Total |
|
Tirunelveli |
256 |
3 |
7,227.94 |
4,194.44 |
1023.51 |
1266.27 |
2,286.76 |
13,709.38 |
| 1 |
Alangulam |
2 |
|
0.00 |
120.37 |
8.20 |
13.04 |
21.24 |
141.61 |
| 2 |
Cheranmahadevi |
65 |
|
7.00 |
1,125.71 |
151.97 |
68.89 |
220.86 |
1,353.58 |
| 3 |
Kalakad |
2 |
|
0.00 |
54.62 |
12.00 |
27.30 |
39.30 |
93.92 |
| 4 |
Manur |
30 |
2 |
2,431.51 |
952.23 |
141.38 |
457.40 |
598.17 |
3,981.90 |
| 5 |
Nanguneri |
52 |
|
0.00 |
1,126.77 |
199.98 |
164.27 |
364.20 |
1,490.94 |
| 6 |
Palayamkottai |
100 |
1 |
4,541.94 |
814.74 |
504.97 |
496.29 |
1001.28 |
6,356.28 |
| 7 |
Pappakudi |
5 |
|
247.49 |
0.00 |
5.01 |
39.08 |
43.67 |
291.16 |
|
Tuticorin |
59 |
2 |
2,650.81 |
7,041.89 |
1444.09 |
332.37 |
1,776.42 |
11,469.11 |
| 1 |
Alwarthirunagari |
15 |
|
208.93 |
1,499.24 |
290.53 |
20.33 |
310.85 |
2,019.02 |
| 2 |
Karungulam |
25 |
1 |
1,650.23 |
1,985.15 |
396.14 |
301.96 |
698.07 |
4,333.43 |
| 3 |
Sathankulam |
1 |
|
0.00 |
25.94 |
0.00 |
4.58 |
4.58 |
30.52 |
| 4 |
Srivaikuntam |
18 |
1 |
791.65 |
3,531.56 |
757.42 |
5.50 |
762.92 |
5,086.14 |
|
Grand Total |
315 |
5 |
9,878.75 |
11,236.33 |
2467.60 |
1598.64 |
4,066.82 |
25,178.49 |
2.2. Location of sub-basin

2.3. Climate and Rainfall pattern
2.3.1. Rainfall
Main rainy season is from October to the middle of January. During the southwest monsoon season the rainfall is more in the western parts of the district. November is generally the rainiest month. The average rain fall in the district is 963.09 mm per annum. Gadananathi sub-basin receives substantial rainfall during south west monsoon apart from receiving high rainfall during North east monsoon season.
| Month / Season |
Rainfall (mm) |
| Winter Season |
|
| January |
24.35 |
| February |
39.71 |
| Total |
64.05 |
| Summer |
|
| March |
70.61 |
| April |
73.95 |
| May |
49.11 |
| Total |
193.64 |
| South West Monsoon |
|
| June |
36.79 |
| July |
29.16 |
| August |
25.50 |
| September |
42.45 |
| Total |
131.58 |
| North East Monsoon |
|
| October |
207.11 |
| November |
263.66 |
| December |
102.45 |
| Total |
573.17 |
| Grand Total |
963.09 |
2.4. Soil types
| Soil order |
Soil Characteristics |
Crop Suitability |
| Inceptisol |
Red or brown or grey soil with surface horizon more developed than sub surface. They are developing soils, moderately deep, coarse loamy to loam moderately drained to well drained |
Suited for commonly grown crops with exceptions |
| Alfisol |
The red or brown soils having accumulation of alleviated clay in sub surface horizon it well drained, poor water and nutrient holding capacity. |
Annual crops with shallow roots systems cum up wells |
| Vertisols |
Black soil |
Suitable for cotton, Pulses etc |
2.5. Season wise crop scenario in the sub basin
| Major crops cultivated |
| Paddy |
Paddy is the principal crop extensively cultivated in two seasons– season viz Kar (June – September), Pishanam (October to January). Normal productivity of Rice per Hectare is 5344 Kg. |
| Pulses |
Larger Area of Pulses is cultivated during Rabi season. The normal productivity of pulses is 716 kg / ha. Blackgram is the Predominant pulses crop cultivated. |
| Oilseeds |
Groundnut is the major oilseed crop cultivated under Kharif and Rabi season. Major area cultivated during Rabi Season. The Normal productivity is 1725 kg / ha. |
2.6. Existing scenario of irrigation practices
The available water is being utilized through Flood irrigation. The water use efficiency is less compared improved methods of irrigation. Based on the availability of water the selection of crop can be made. Micro irrigation practices are getting popularized among the farmers.
3. Existing cropping pattern in the sub basin
Lower Tamiraparani Sub Basin -Cropping Pattern:
| S.No |
Crop |
Without Project |
With Project |
Increasing |
| FI |
PI |
RF/G |
Total |
FI |
PI |
RF/G |
Total |
| I |
Perennial crop |
| 1 |
Coconut |
63.98 |
24.46 |
0.00 |
88.44 |
63.98 |
24.46 |
0.00 |
88.44 |
0.00 |
| 2 |
Mango |
0.00 |
1.00 |
0.00 |
1.00 |
0.00 |
1.00 |
0.00 |
1.00 |
0.00 |
| 3 |
Guava |
0.00 |
0.00 |
0.00 |
0.00 |
0.00 |
0.00 |
0.00 |
0.00 |
0.00 |
| 4 |
Other Tree crops |
0.00 |
10.09 |
0.00 |
10.09 |
0.00 |
10.09 |
0.00 |
10.09 |
0.00 |
| 5 |
Flowers\Tube Rose |
0.00 |
5.65 |
0.00 |
5.65 |
0.00 |
5.65 |
0.00 |
5.65 |
0.00 |
| 6 |
Fodder |
0.00 |
4.13 |
0.00 |
4.13 |
0.00 |
4.13 |
0.00 |
4.13 |
0.00 |
|
Total |
63.98 |
45.32 |
0.00 |
109.30 |
63.98 |
45.32 |
0.00 |
109.30 |
0.00 |
| II |
Annual Crop |
|
|
|
|
|
|
|
|
|
| 1 |
Sugarcane |
0.00 |
5.00 |
0.00 |
5.00 |
5.00 |
0.00 |
0.00 |
5.00 |
0.00 |
| 2 |
Banana |
1,078.50 |
3,940.47 |
0.00 |
5,018.9 |
5,018.9 |
0.00 |
0.00 |
5,018.97 |
0.00 |
| 3 |
T.C. Banana |
0.00 |
0.00 |
0.00 |
0.00 |
0.00 |
0.00 |
0.00 |
0.00 |
0.00 |
| 4 |
Tapiaco |
0.00 |
0.23 |
0.00 |
0.23 |
0.23 |
0.00 |
0.00 |
0.23 |
0.00 |
|
Total |
1,078.50 |
3,945.47 |
0.00 |
5,023.97 |
5,023.9 |
0.00 |
0.00 |
5,023.97 |
0.00 |
| III |
1st crop |
|
|
|
|
|
|
|
|
|
| 1. a |
Paddy |
2,470.65 |
77.00 |
0.00 |
2,547.65 |
0.00 |
0.00 |
0.00 |
0.00 |
-2,547.65 |
| b |
Paddy - SRI |
0.00 |
0.00 |
0.00 |
0.00 |
2,547.6 |
0.00 |
0.00 |
2,547.65 |
2,547.65 |
| 2 |
Maize |
0.00 |
0.00 |
0.00 |
0.00 |
56.00 |
0.00 |
0.00 |
56.00 |
56.00 |
| 3 |
Pulses |
0.00 |
0.00 |
0.00 |
0.00 |
120.00 |
0.00 |
0.00 |
120.00 |
120.00 |
| 4 |
Tomato |
0.00 |
19.45 |
0.00 |
19.45 |
71.00 |
0.00 |
0.00 |
71.00 |
51.55 |
| 5 |
Bhendi |
0.00 |
118.30 |
0.00 |
118.30 |
462.30 |
0.00 |
0.00 |
462.30 |
344.00 |
| 6 |
Brinjal |
0.00 |
50.40 |
0.00 |
50.40 |
234.20 |
0.00 |
0.00 |
234.20 |
183.80 |
| 7 |
Onion |
0.00 |
20.00 |
0.00 |
20.00 |
20.00 |
0.00 |
0.00 |
20.00 |
0.00 |
| 8 |
Gourds |
0.00 |
46.95 |
0.00 |
46.95 |
146.00 |
0.00 |
0.00 |
146.00 |
99.05 |
| 9 |
Cluster Beans |
0.00 |
0.51 |
0.00 |
0.51 |
0.54 |
0.00 |
0.00 |
0.54 |
0.02 |
| 10 |
Greens |
0.40 |
0.00 |
0.00 |
0.40 |
0.40 |
0.00 |
0.00 |
0.40 |
0.00 |
| 11 |
Chillies |
0.00 |
20.00 |
0.00 |
20.00 |
81.00 |
0.00 |
0.00 |
81.00 |
61.00 |
| 12 |
Veg Cowpea |
0.00 |
1.00 |
0.00 |
1.00 |
1.00 |
0.00 |
0.00 |
1.00 |
0.00 |
| 13 |
Water melon |
0.00 |
3.50 |
0.00 |
3.50 |
0.00 |
3.50 |
0.00 |
3.50 |
0.00 |
|
Total |
2,471.05 |
357.11 |
0.00 |
2,828.1 |
3,740.1 |
3.50 |
0.00 |
3,743.59 |
915.42 |
|
G. Total (I+II+III) |
3,613.53 |
4,347.90 |
0.00 |
7,961.4 |
8,828.1 |
48.82 |
0.00 |
8,876.85 |
915.42 |
| IV |
2 nd crop |
|
|
|
|
|
|
|
|
|
| 1. a |
Paddy |
11,312.3 |
3,129.86 |
0.00 |
14,442 |
0.00 |
0.00 |
0.00 |
0.00 |
-14,442.2 |
| b |
Paddy - SRI |
0.00 |
0.00 |
0.00 |
0.00 |
18,325 |
0.00 |
0.00 |
18,325.01 |
18,325.01 |
| 3 |
Pulses |
0.00 |
0.00 |
0.00 |
0.00 |
150.00 |
0.00 |
0.00 |
150.00 |
150.00 |
| 4 |
Groundnut |
0.00 |
0.00 |
0.00 |
0.00 |
0.00 |
0.00 |
0.00 |
0.00 |
0.00 |
| 5 |
Redgram |
0.00 |
0.00 |
0.00 |
0.00 |
0.00 |
0.00 |
0.00 |
0.00 |
0.00 |
| 6 |
Fallow |
0.00 |
0.00 |
5,602.8 |
5,602.8 |
0.00 |
0.00 |
1,570.10 |
1,570.10 |
-4,032.72 |
|
Total |
11,312.3 |
3,129.86 |
5,602.8 |
20,045 |
18,475 |
0.00 |
1,570.10 |
20,045.11 |
0.05 |
| V |
3rd crop |
|
|
|
|
|
|
|
|
|
| 1. a |
Paddy |
0.00 |
0.00 |
0.00 |
0.00 |
0.00 |
0.00 |
0.00 |
0.00 |
0.00 |
| b |
Paddy - SRI |
0.00 |
0.00 |
0.00 |
0.00 |
364.53 |
0.00 |
0.00 |
364.53 |
364.53 |
| 2 |
RF Pulses |
0.00 |
0.00 |
7,190.1 |
7,190.1 |
0.00 |
0.00 |
10,718.9 |
18,245.11 |
11,054.99 |
| 3 |
Groundnut |
64.00 |
0.00 |
0.00 |
64.00 |
110.00 |
0.00 |
0.00 |
110.00 |
46.00 |
| 4 |
Cotton |
75.01 |
3.35 |
0.00 |
78.36 |
108.19 |
3.00 |
0.00 |
111.19 |
32.83 |
|
Total |
139.01 |
3.35 |
7,190.1 |
7,332.5 |
582.72 |
3.00 |
10,718.9 |
18,830.83 |
11,498.35 |
|
Great Grand Total |
15,064.9 |
7,481.11 |
12,792.9 |
35,338.9 |
27,885.76 |
51.82 |
12,289.01 |
47,752.79 |
12,413.82 |
|
Cropping Intensity |
|
|
|
180.53 |
|
|
|
202.27 |
21.74 |
3.1. Area, production and productivity of crops in the sub basin
Area, Production and Productivity
| Sl. No. |
Crop |
Without Project |
With Project |
| S.No |
Crop |
Without Project |
With Project |
| Area (Ha.) |
Production (L.MT.) |
Productivity (MT./ha.) |
Area (ha.) |
Production (L.MT.) |
Productivity (M.T/ha.) |
| 1 |
Paddy |
16,990 |
0.9079 |
5344 |
21,795 |
1.4559 |
6680 |
| 2 |
Maize |
16.07 |
0.0010 |
6505 |
136 |
0.0111 |
8131 |
| 3 |
Blackgram |
4.5 |
0.0000 |
716 |
95 |
0.0009 |
895 |
| 4 |
Groundnut |
65 |
0.0011 |
1725 |
110 |
0.0024 |
2156 |
3.2. Constraints, Challenges and Suggestive Measures
| Constraints and Challenges |
Suggestive Measures |
| Soil Constraints |
Only 1% of the area is under problem soil viz soil alkalinity hence soil reclamation is essential. |
| Adverse climatic condition and erratic distribution of rainfall |
The temperature is generally high and drought occurs once in five years. Suitable contingent plan may be prepared to overcome drought. Crop diversification will be introduced to increase the productivity. |
| Inferior quality of seeds, Planting materials and high cost of hybrid seeds. |
Farmers are using local and poor quality seeds. Many farmers use their seeds and also exchange seeds among themselves. Supply of seeds through National Seeds Corporation and other private organizations will be arranged as per procurement norms of the World Bank. |
| Improper irrigation practices (Flood irrigation). |
Cultivation of paddy crop by following SRI technique will be popularized among the farmers to save water and labour. Micro irrigation for vegetable and fruit crops will be introduced in the sub basin to increase the productivity of crop. |
| Inadequate extension Service. |
The services of TNAU will be utilized for disseminating innovative technologies for various crops in the sub basin in addition to the state extension services based on necessity. |
| Availability of labour. |
Labour availability is a problem due to migration of labours to urban area to get more wages by doing non agricultural works. Spinning mill / ginning factories are more popular in this district. Hence labour availability is a problem for farm work. Lower availability skilled labours than unskilled labours To overcome the above mentioned problems suitable farm mechanization measures will be undertaken. |
| Low price for produce |
Price fluctuation for fruits and vegetables due flooding of same product and inadequate storage facilities, The staggered planting will recommended to overcome price fluctuation in vegetables especially during peak period of harvest. Early season varieties will be recommended to synchronize with market demand |
4. Field interventions
4.1 Productivity enhancement in Rice
4.1.1. Green Manure – Rice - Pulses
Scientific management technique of allocating irrigation water based on soil and climatic condition to achieve maximum crop production per unit of water applied over a unit area in unit time is very much essential under present condition. System of Rice Intensification (SRI) is one among the scientific management tool. Under conventional system of rice cultivation the rice yield will be low due to poor water and weed management, poor aeration affects the root activity and tiller production and Poor water management increases the water requirement. Efficient water management reduces the irrigation water requirement.
| S. No. |
Technology |
Area(ha) |
Unit cost(Rs.) |
Total cost( Rs. In lakhs) |
| 1. |
Green Manure – Rice - Pulses |
500 |
10000 |
50.00 |
Details of Unit Cost; Green Manure
| S. No. |
Particulars |
Amount (Rs.) |
| 1. |
Seed cost 40 kg/ha @ Rs. 50/kg |
2000.00 |
|
Grand Total |
2000.00 |
Details of Unit Cost; Rice
| S. No |
Particulars |
Amount(Rs.) |
| 1 |
Cost of Soil testing |
20.00 |
| 2 |
Seed cost - 10 kg / ha @ Rs.30/kg |
300.00 |
| 3 |
Cost of nursery raising |
- |
| 4 |
Cost of fertilizers (150:50:50 kg NPK / ha) |
|
Urea - 300 kg/ha @ Rs.6 /kg |
1,800.00 |
|
Muriate of Potash – 80 kg @ Rs.16/kg |
1,280.00 |
|
ZnSO4 25 kg @ Rs.40/kg |
1,000.00 |
| 5 |
Bio fertilizer & Bio inoculants |
1,600.00 |
|
Grand Total |
6,000.00 |
Details of Unit Cost; Rice Fallow Pulses
| S. No |
Particulars |
Amount(Rs) |
| 1. |
Seed cost 20 kg/ha @ Rs. 100/kg |
2000.00 |
|
Grand Total |
2000.00 |
4.1.2. SRI
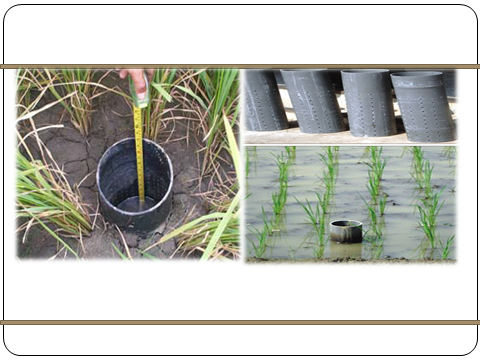
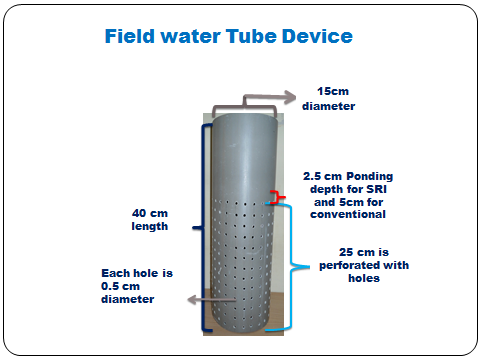
A modern water saving technology in rice: Safe Alternate Wetting and Drying Irrigation (AWDI)
For adopting the safe AWDI, the depth of ponded water on the field is monitored using a ‘Field Water Tube’ which is made of 40-cm long plastic pipe having a diameter of 15 cm which is perforated with holes on all sides. The tube is dug in the soil so that 15 cm protrudes above the soil surface and the soil from inside is removed so that the bottom of the tube is visible. The water table inside the tube is to be same as outside the tube.
The results of network experiments on safe AWDI conducted by the WTC of Tamil Nadu Agricultural University for the past three years revealed that safe AWDI of 10 cm depletion in light soils and 15 cm in heavy soils may be adopted as safe AWDI for improving the water use efficiency in rice. The ponding depth was 5cm after reaching the threshold level. The following observations were also recorded.
- In rice cultivation, conventional flooding should be avoided which consumes huge quantity of irrigation water (as high as 1573 mm)
- The Alternate Wetting and Drying Irrigation (AWDI) will be an appropriate technology for water saving in rice. This technology saves up to 30 percent of irrigation water with an yield increment up to 20 percent.
- 4-5 irrigations were reduced under AWDI when compared to conventional method.
- Considering the depletion levels in AWDI, irrigation once in 6-7 days in sandy loam soils and 8-9 days in clay loam soils may be adopted for improved WUE and productivity of rice.
Interventions suggested:
In all the rice growing regions, flooding shall be avoided and the water level beneath the surface may be monitored initially thro’ field water tubes installed @ 3 tubes/ha for standardizing the safe AWDI level. Then the frequency of irrigation could be recommended based on the number of days for each region and soil type.
| S. No. |
Technology |
Area(ha) |
Unit cost(Rs.) |
Total cost(Rs. In lakhs) |
| 1. |
SRI |
500 |
10000 |
30.00 |
Details of Unit Cost: SRI
| S. No |
Particulars |
Amount(Rs.) |
| 1 |
Cost of Soil testing |
20.00 |
| 2 |
Seed cost - 10 kg / ha @ Rs.30/kg |
300.00 |
| 3 |
Cost of nursery raising |
- |
| 4 |
Cost of fertilizers (150:50:50 kg NPK / ha) |
|
Urea - 300 kg/ha @ Rs.6 /kg |
1,800.00 |
|
Muriate of Potash – 80 kg @ Rs.16/kg |
1,280.00 |
|
ZnSO4 25 kg @ Rs.40/kg |
1,000.00 |
| 5 |
Bio fertilizer & Bio inoculants |
1,600.00 |
|
Grand Total |
6,000.00 |
4.2 Pulses seed production programme: Production of TFL seeds under farmers’ participatory approach to produce quality pulse seeds
Pulses are one of the most important food components in maintaining the health of the human beings. Tamil Nadu is a deficit State in pulses requirement. More incidence of yellow mosaic virus in the traditional varieties and non availability of quality seed material during the peak season are few constrains in pulse production.
| S. No. |
Technology |
Area(ha) |
Unit cost(Rs.) |
Total cost(Rs. In lakhs) |
| 1. |
TFL seed production in pulses |
200 |
6000 |
12.00 |
Details of Unit Cost: TFL seed pulses
| S. No |
Particulars |
Amount (Rs.) |
| 1. |
Cost of Soil testing |
20.00 |
| 2. |
Seed cost with seed treatment - 20 kg / ha @ Rs.150/kg |
3,000.00 |
| 3. |
DAP 25 kg / ha @ Rs.22.50/kg |
560.00 |
| 4. |
Pulse Wonder 2 kg/ha @ Rs.220/kg |
440.00 |
| 5. |
Cleaning and Packaging of seeds |
1,000.00 |
| 6. |
Bio fertilizers and Bio inoculants |
980.00 |
|
Grand Total |
6,000.00 |
4.3 Area Enhancement, Area Expansion and productivity enhancement of Pulses under crop diversification in gap areas
With a decreasing area under cultivation, the possibility to improve the production of pulses through the adoption of high yielding and resistant varieties with improved packages of practices. Being a short duration crop, more crop to be raised for more yield.
| S. No. |
Technology |
Area(ha) |
Unit cost(Rs.) |
Total cost( Rs. In lakhs) |
| 1. |
Area Expansion and productivity enhancement of Pulses under crop diversification in gap areas |
500 |
5000 |
25.00 |
Details of Unit Cost: Area expansion pulses
| S. No |
Particulars |
Amount(Rs.) |
| 1. |
Cost of Soil testing |
20.00 |
| 2. |
Seed cost with seed treatment - 20 kg / ha @ Rs.150/kg |
3,000.00 |
| 3. |
DAP 25 kg / ha @ Rs.22.50/kg |
560.00 |
| 4. |
Pulse Wonder 2 kg/ha @ Rs.220/kg |
440.00 |
| 5. |
Bio fertilizers and Bio inoculants |
980.00 |
|
Grand Total |
5,000.00 |
4.4. Production of vegetable under precision farming mode by adopting IPM concept
Precision farming is an approach where inputs, including water and fertilizers, are applied in precise amounts to maximize yields by reducing water use, residues in soil and water, and chemical sprays, and substantially increased average yields compared to traditional cultivation techniques. Precision farming provides a new solution to balance productivity with environmental concerns. Based on advanced information technology, it includes describing and modeling variation in soils and plant species and integrating agricultural practices to meet site specific requirements. The strategies of precision farming are
- Reduction in fertilizer, chemical and seed costs
- Increase in yields
- Improvement in the quality of the crop
- Longer working hours and high labour productivity.
| S. No. |
Technology |
Area(ha) |
Unit cost(Rs.) |
Total cost(Rs. In lakhs) |
| 1. |
Production of vegetable crops under precision farming by adopting IPM concept |
158 |
120000 |
189.60 |
Details of Unit Cost: Vegetables
| S. No |
Particulars |
Amount (Rs.) |
| 1. |
Drip cost as per the Govt. norms @ 75 % subsidy |
75,000.00 |
| 2. |
Cost of Seed/Seedlings |
25,000.00 |
| 3. |
Water Soluble fertilizers |
|
19:19:19-100 kg @ Rs.75/kg |
7,500.00 |
|
Urea - 200 kg @ Rs.6/kg |
- |
|
MAP-50 kg @ Rs.90/kg |
4,500.00 |
|
SSP-100kg @ Rs.7.5/kg |
750.00 |
| 4. |
Bio fertilizer |
1,750.00 |
| 5. |
Mulching sheets & Laying |
5,500.00 |
|
Grand Total |
1,20,000.00 |
4.5. Introduction of new technologies in fruit crops by demonstrating TNAU high density planting with drip fertigation in mango
High density planting is the planting of more number of plants than optimum through manipulation of tree size. It is one of the improved production technologies to achieve the objective of enhanced productivity of fruit crops. HDP aims at maintaining a balance between vegetative and reproductive load without impairing the plant health.
Advantages of High Density Planting
- Lower gestation period when dwarf hybrid varieties and pruning techniques are followed.
- Higher yield from small area due to more number of trees.
- Optimum utilization of available natural resources viz., land, water and sunshine.
- Due to pruning, the height of trees is under control facilitating mechanized harvesting of the matured fruits.
- Harvesting and handling of fruits in the field is easier.
- Regular pruning exercise could overcome irregular bearing, common in mango.
| S. No. |
Technology |
Area(ha) |
Unit cost(Rs.) |
Total cost(Rs. In lakhs) |
| 1. |
Introduction of high density planting with drip fertigation in Mango |
10 |
75000 |
7.50 |
Details of Unit Cost: Mango
| S. No |
Particulars |
Amount (Rs.) |
| 1. |
Drip cost as per the Govt. norms @75% Subsidy |
26,000.00 |
| 2. |
Cost of Seed/Seedlings (400 Nos/ha) @Rs.70.00 |
28,000.00 |
| 3. |
Water Soluble fertilizers (19:19:19, MAP, Urea) |
19,500.00 |
| 4. |
Bio inoculants & Bio fertilizers |
1,500.00 |
|
Grand Total |
75,000.00 |
4.6. Formation of pulse Commodity groups:
| S. No. |
Intervention |
Unit Cost |
No. of groups |
Amount(Rs. in Lakhs) |
| 1. |
Formation of Pulse commodity groups and federated to FPO (Seed to sales) and later linking with the Marketing Dept. |
2000 |
60 |
1.20 |
4.7. Promotion of pesticide free villages:
| S. No. |
Intervention |
Unit Cost |
No. of groups |
Amount(Rs. in Lakhs) |
| 1. |
Promotion of Pesticide Free vegetables in sub-basins through climate resilience activity in model Bio Villages known as pesticide free Village |
2500 |
60 |
1.50 |
5. Capacity Building & Information, Education & Communication
5.1. Capacity building
5.1.1. Training to stakeholders
Under this activity, imparting training to all the beneficiaries either as off-campus or as on-campus is planned.
| Sl. No. |
Particulars |
Duration (days) |
No/batch |
Total batch |
Budget / batch |
Total budget (lakhs) |
| 1. |
Nursery technology for SRI paddy |
1 |
50 |
5 |
10,000 |
0.50 |
| 2. |
Seed production in Pulses |
1 |
50 |
5 |
10,000 |
1.00 |
| 3. |
Pesticide free vegetable cultivation practices |
1 |
50 |
5 |
10,000 |
0.50 |
| 4. |
Precision farming practices for vegetables |
1 |
50 |
5 |
10,000 |
1.00 |
| 5. |
GAP and HDP for fruit crops |
1 |
50 |
10 |
10,000 |
1.00 |
|
|
|
|
|
Total |
4.00 |
5.1.2. Exposure visit
In-order to have practical knowledge on various improved farming practices prevailing across the District and State, it has been proposed to expose the stakeholders by organizing educational tours for having better cross learning.
5.2. IEC including Awareness creation, documentation and IEC equipment
5.2.1. Organize awareness campaign
- Informal meetings with Farmers / Water Users Association through PRA methods – Focus group discussion and transect walk.
- Organizing informal meetings in sub basin villages
- Message on AIR / local cable TV
- Ensure transparency
- Explain about the scheme – organization objectives, activities, project contribution and farmers share
- Emphasis the role of stake holders in the project
- Project the expected benefit
5.2.2. Documentation
- Maintenance of records and registers
- Field note for each activity
- Daily memorandum sheet
- Receipt and issue of inputs
- Technical observations on soil, water and crop
- Printing pamphlets about the scheme
- Wall paintings
5.2.3. IEC Equipments:
purchase of Laptop, Camera and computer accessories
5.2.4. Out sourcing charges on vehicles
- Expenditure on TA /DA for the purpose of TNIAMP Project
- Fuel bill of university vehicle utilized for the project
- Hire charges of university vehicle utilized for this purpose
6. Management Cost
6.1. Outsourcing of technical staff
Outsourcing of technical staff is included in TNAU sub basin plan to carry out the field activities.
7. Year wise crop based Activities
| S. No. |
Particulars |
Area (ha) |
Total (ha) |
| I |
II |
III |
IV |
V |
| A |
Activities |
| 1 |
GM-SRI - Pulses |
50 |
125 |
125 |
100 |
100 |
500 |
|
SRI |
50 |
125 |
125 |
100 |
100 |
500 |
| 2 |
TFL seed production on pulses |
20 |
50 |
50 |
40 |
40 |
200 |
| 3 |
Area expansion and area enhancement |
50 |
125 |
125 |
100 |
100 |
500 |
| 4 |
Vegetable under precision farming and IPM concept |
20 |
48 |
45 |
45 |
0 |
158 |
| 5 |
TNAU High density planting with MI in Mango/Pomegranate |
2 |
5 |
3 |
0 |
0 |
10 |
|
Total |
192 |
478 |
473 |
385 |
340 |
1868 |
Total Budget (Year wise) for-Lower Tamiraparani Sub-basin
P-Physical in ha, F-Financial in rupees in lakhs
| S. No |
Particulars |
Unit cost Rs/ha |
I Year |
II Year |
III Year |
IV Year |
V Year |
VI Year |
Total |
| A |
Activities |
P |
F |
P |
F |
P |
F |
P |
F |
P |
F |
P |
F |
P |
F |
| 1 |
GM-SRI - Pulses |
10000 |
50 |
5.00 |
125 |
12.50 |
125 |
12.50 |
100 |
10.00 |
100 |
10.00 |
0 |
0.00 |
500 |
50.00 |
|
SRI / AWDI |
6000 |
50 |
3.00 |
125 |
7.50 |
125 |
7.50 |
100 |
6.00 |
100 |
6.00 |
0 |
0.00 |
500 |
30.00 |
| 2 |
Pulse seed production programme : Production of TFL Seeds under farmers participatory approach to produce quality pulse seeds |
6000 |
20 |
1.20 |
50 |
3.00 |
50 |
3.00 |
40 |
2.40 |
40 |
2.40 |
0 |
0.00 |
200 |
12.00 |
| 3 |
Area Enhancement, Area Expansion and productivity enhancement of pulses under crop diversification in gap areas: (Black gram/Green gram) |
5000 |
50 |
2.50 |
125 |
6.25 |
125 |
6.25 |
100 |
5.00 |
100 |
5.00 |
0 |
0.00 |
500 |
25.00 |
| 4 |
Production of vegetable under precision farming mode by adopting of IPM concept. |
120000 |
20 |
24.00 |
48 |
57.60 |
45 |
54.00 |
45 |
54.00 |
0 |
0.00 |
0 |
0.00 |
158 |
189.60 |
| 5 |
TNAU High density planting with MI in Mango/Pomegranate |
75000 |
2 |
1.50 |
5 |
3.75 |
3 |
2.25 |
0 |
0.00 |
0 |
0.00 |
0 |
0.00 |
10 |
7.50 |
| 6 |
Formation of Pulse commodity groups and federated to FPO (Seed to sales) and later linking with the Marketing Dept. |
2000 |
20 |
0.40 |
10 |
0.20 |
10 |
0.20 |
10 |
0.20 |
10 |
0.20 |
0 |
0.00 |
60 |
1.20 |
| 7 |
Promotion of Pesticide Free vegetables in sub-basins through climate resilience activity in model Bio Villages known as pesticide free Village |
2500 |
20 |
0.50 |
10 |
0.25 |
10 |
0.25 |
10 |
0.25 |
10 |
0.25 |
0 |
0.00 |
60 |
1.50 |
|
Total A |
|
232 |
38.10 |
498 |
91.05 |
493 |
85.95 |
405 |
77.85 |
360 |
23.85 |
0 |
0.00 |
1988 |
316.80 |
| B |
Implements for farm mechanization |
|
|
|
|
|
|
|
|
|
|
|
|
|
|
|
| 8 |
Cono weeder |
1000 |
50 |
0.50 |
125 |
1.25 |
125 |
1.25 |
100 |
1.00 |
100 |
1.00 |
0 |
0.00 |
500 |
5.00 |
| 9 |
Field Water tube (Panipipe) |
250 |
150 |
0.38 |
375 |
0.94 |
375 |
0.93 |
300 |
0.75 |
300 |
0.75 |
0 |
0.00 |
1500 |
3.75 |
|
Total B |
|
200 |
0.88 |
500 |
2.19 |
500 |
2.18 |
400 |
1.75 |
400 |
1.75 |
0 |
0.00 |
2000 |
8.75 |
|
Sub Total (A+B) |
|
432 |
38.98 |
998 |
93.24 |
993 |
88.13 |
805 |
79.60 |
760 |
25.60 |
0 |
0.00 |
3988 |
325.55 |
| II |
IEC & CB |
|
|
|
|
|
|
|
|
|
|
|
|
|
|
|
| 1 |
Capacity Building |
|
|
|
|
|
|
|
|
|
|
|
|
|
|
|
|
a) Training to stake holders |
|
|
1.00 |
|
1.00 |
|
1.00 |
|
0.50 |
|
0.50 |
|
0.00 |
|
4.00 |
|
b) Exposure Visit |
|
|
0.50 |
|
0.50 |
|
0.50 |
|
0.00 |
|
0.00 |
|
0.00 |
|
1.50 |
| 2 |
IEC |
|
|
|
|
|
|
|
|
|
|
|
|
|
|
|
|
a)Awareness Creation activities |
|
|
0.50 |
|
0.50 |
|
0.50 |
|
0.25 |
|
0.10 |
|
0.00 |
|
1.85 |
|
b) Documentation |
|
|
0.40 |
|
0.30 |
|
0.30 |
|
0.10 |
|
0.10 |
|
0.10 |
|
1.30 |
|
c) IEC equipments |
|
|
0.75 |
|
0.00 |
|
0.00 |
|
0.00 |
|
0.00 |
|
0.00 |
|
0.75 |
|
d) Outsourcing of vehicle and TA |
|
|
0.65 |
|
0.65 |
|
0.65 |
|
0.65 |
|
0.35 |
|
0.30 |
|
3.25 |
|
Total |
|
|
3.80 |
|
2.95 |
|
2.95 |
|
1.50 |
|
1.05 |
|
0.40 |
|
12.65 |
| III |
Management cost |
|
|
|
|
|
|
|
|
|
|
|
|
|
|
|
| 1 |
Out sourcing of technical staff |
|
|
4.28 |
|
9.62 |
|
9.12 |
|
8.12 |
|
2.68 |
|
0.00 |
|
33.82 |
|
Total |
|
|
4.28 |
|
9.62 |
|
9.12 |
|
8.12 |
|
2.68 |
|
0.00 |
|
33.82 |
|
Over all Total |
|
|
47.06 |
|
105.81 |
|
100.20 |
|
89.22 |
|
29.33 |
|
0.40 |
|
372.02 |
Lower Tamiraparani
| S.No |
Intervention details |
Unit cost Rs/ha |
P |
F |
| I |
A.Field Interventions |
|
|
|
| 1 |
GM-SRI-Pulses |
10000 |
500 |
50.00 |
|
SRI |
6000 |
500 |
30.00 |
| 2 |
Pulse seed production programme : Production of TFL Seeds under farmers participatory approach to produce quality pulse seeds |
6000 |
200 |
12.00 |
| 3 |
Area Enhancement, Area Expansion and productivity enhancement of pulses under crop diversification in gap areas: |
5000 |
500 |
25.00 |
| 4 |
Production of vegetable under precision farming mode by adopting of IPM concept. |
120000 |
158 |
189.60 |
| 5 |
Introduction of new technologies in fruit crops by demonstrating TNAU High density planting with drip fertigation in Mango/Pomegranate etc., |
75000 |
10 |
7.50 |
| 6 |
Formation of Pulse commodity groups and federated to FPO (Seed to sales) and later linking with the Marketing Dept. |
2000 |
60 |
1.20 |
| 7 |
Promotion of Pesticide Free vegetables in sub-basins through climate resilience activity in model Bio Villages known as Pesticide Free Village. |
2500 |
60 |
1.50 |
|
B.Implements for farm mechanization |
|
|
|
| 8 |
Cono weeder |
1000 |
500 |
5.00 |
| 9 |
Field water tube(Panipipe) |
250 |
1500 |
3.75 |
|
Sub Total (A+B) |
|
3988 |
325.55 |
| II |
IEC & CB |
|
|
|
| 1 |
Capacity Building |
|
|
|
|
a). Training to stake holders |
|
|
4.00 |
|
b).Exposure visit |
|
|
1.50 |
| 2 |
IEC |
|
|
|
|
a).Awareness Creation activities |
|
|
1.85 |
|
b).Documentation |
|
|
1.30 |
|
c).IEC equipments |
|
|
0.75 |
|
d) Outsourcing of vehicle and TA |
|
|
3.25 |
|
Sub Total |
|
|
12.65 |
| III |
Management cost |
|
|
|
| 1 |
Out sourcing of technical staff |
|
|
33.82 |
|
Over all Total (I+II+III) |
|
|
372.02 |