1. About the Agricultural Research Station, Vaigai Dam
Agricultural Research Station, Vaigai Dam located in Theni district was started during 1965 as Government sub station for Cotton Research by Dept. of Agriculture, Government of Tami Nadu. During 1995, the farm was handed over to Tamil Nadu Agricultural University on 21.08.1995 and is now known as Agricultural Research Station, Vaigai Dam. Since then, this station has been contributing to the welfare of the farmers through production and distribution of quality seeds. The station is situated at 10◦0◦ North latitude and 77.8 East longitude with an altitude of 242 MSL. It is one of the two research stations identified exclusively for seed production by the Tamil Nadu Agricultural University. It has two farms; one located at the base of Vaigai dam (Farm I) with an area of 21.6 ha In Periyakulam Taluk and Farm II with an area of 42.2 ha. Is located in Aundipatty taluk 6.0 km away from Farm I.
2. About the Sub Basin
2.1 Description of Vaigai Basin
The Vaigai river basin forms one of the important river basins of Southern Tamil Nadu with its fertile, lush green paddy fields and well developed irrigation system. Next to Cauvery river basin, this basin can be considered as the granary of Southern Tamil Nadu. Vaigai, the main river originating from Varushanadu valley with its tributaries forms a well defined, compact drainage basin. It has a varied climatic condition resulting often in unreliable rainfall, drought prone, sudden floods, etc. This gives rise to unpredictable water resources condition but for the Periyar reservoir water flowing through this basin due to the construction of the Periyar trans basin scheme which made it possible to divert waters from the Periyar basin in the State of Kerala to Tamil Nadu.
2.2. Location and Extent
Vaigai river basin covers an area of about 7031 sq. km. and located in the Madurai Sivagangai and Ramanathapuram Districts of Tamil Nadu. A small portion of the basin area on the west is also located in the Idukki District of Kerala. It lies between the geographic co-ordinates N.Lat. 9◦15◦–10◦20◦and E. Long. 77◦10◦– 79◦15◦and falls within the Survey of India degree sheets, 58G, 58F and 58K. The total extent of the area is covered within the administrative boundaries of 20 taluks and 32 blocks of which 14 blocks are full and the remaining 18 blocks are part This basin has been divided into 10 sub basins as follows.
2.3. Area and Percentage of Sub Basins of Vaigai River Basin
| S. No |
Name of the sub basin |
Total area |
Hilly area |
% |
Plain area |
% |
| 1. |
Upper Vaigai |
776.76 |
526.64 |
67.8 |
250.12 |
32.2 |
| 2. |
Suriliyar |
716.45 |
243.95 |
34.1 |
472.50 |
66.0 |
| 3. |
Theniyar |
624.70 |
297.98 |
47.7 |
326.72 |
52.3 |
| 4. |
Varattar-Nagalar |
635.25 |
232.57 |
36.6 |
402.68 |
63.4 |
| 5. |
Varaganathi |
390.29 |
200.65 |
51.4 |
189.64 |
48.6 |
| 6. |
Manjalar- Maruthanathi |
470.00 |
237.54 |
50.5 |
232.46 |
49.5 |
| 7. |
Sirumalaiyar |
525.25 |
127.69 |
24.3 |
397.56 |
75.6 |
| 8. |
Sathiyar |
819.00 |
124.82 |
15.2 |
694.18 |
84.8 |
| 9. |
Uppar |
852.70 |
20.62 |
2.4 |
832.08 |
97.6 |
| 10. |
Lower Vaigai |
1220.60 |
- |
- |
1220.6 |
100 |
|
Total |
7031.00 |
2012.46 |
33.0 |
5018.54 |
57.0 |
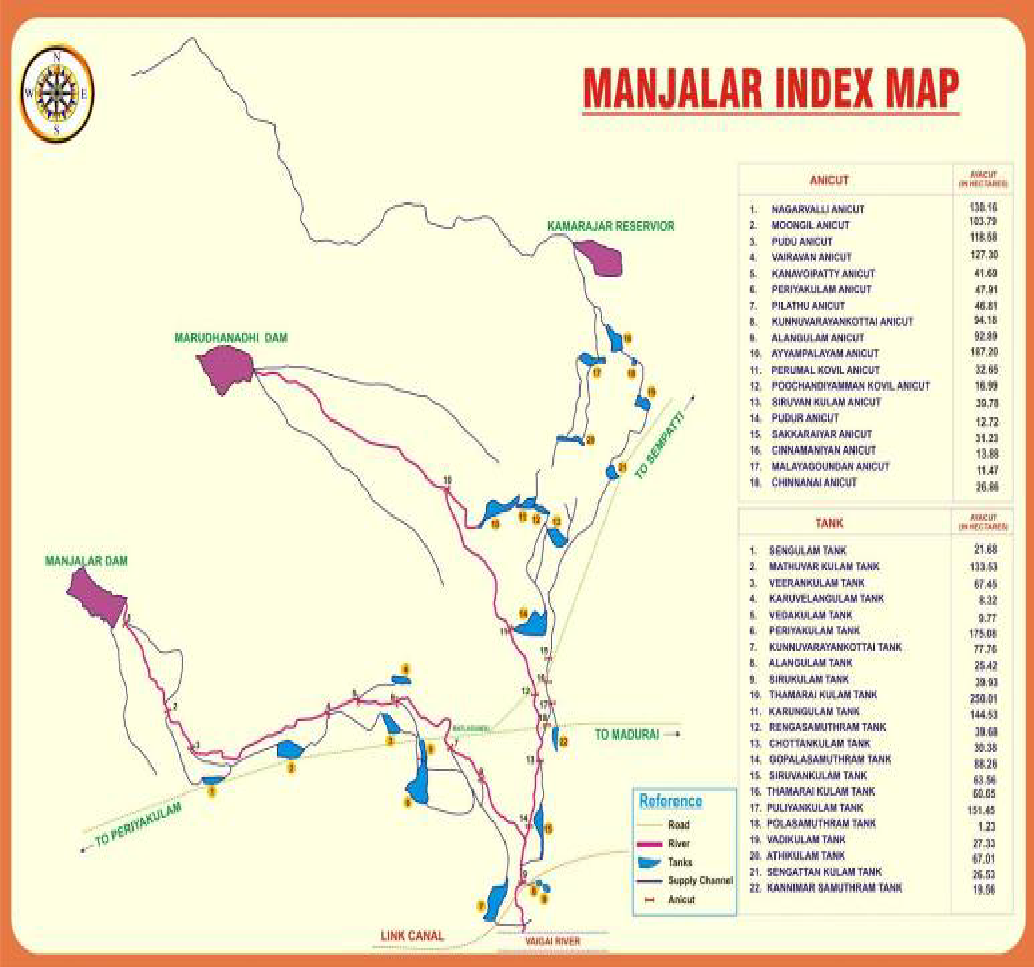
Description ofManjalar Sub Basin
Manjalar and Marudhanadhi originate from the south and east of Palani hills (Kodaikanal hills) and flow, south and south eastern direction and joints in the Vaigai 10 Km. North of Peranai, Mullaiyar, Varattar, and Iruttar are some of the tributaries. Total area of the sub basin is about 470 Km2. About 237.50 Km2 is coming under the plains and about 32.45Km2 is covered under the Palani hills (Kodai hills). At the foot of the Palani hills, Manjalar reservoir is located with a catchment area of about 104 Km2 with a maximum capacity of about 13.59 MCUM. Irrigating about 3240 acres. Mardhanadhi reservoir is situated west of Pattiviranpatti with a catchment area of about 53.89 Km2. It is having a maximum capacity of about 5.34 MCUM and irrigates 3050 acres of wet lands.
The sub basin area of Manjalar is as follows
- Theni District - 232.45 sq.km
- Dindigul District- 237.50 sq.km
The total actual dependable run off is 3.06 Mcft. The Maximum discharge of the river so far measured is 9600 cusecs. The sub basin covers 4 blocks in 3 taluks of two Districts namely Theni and Dindigul districts of Tamilnadu State.
| S.No |
District |
Taluk |
Block |
| 1. |
Theni |
Periyakulam |
Periyakulam |
|
|
Authoor |
Nilakottai |
| 2. |
Dindigul |
Nilakottai |
Batlagundu |
List of Districts, Blocks and Taluks, Tanks and Ayacut Details Proposed in this Project
| S. No |
District |
Block |
Taluk |
No.ofTanks |
Ayacut inHa |
| 1. |
Theni |
Periyakulam |
Periyakulam |
1 |
64.78 |
| 2. |
Dindigul |
Authoor |
Authoor |
6 |
677.281 |
| 3. |
Dindigul |
Nilakotttai |
Nilakotttai |
2 |
65.35 |
| 4. |
Dindigul |
Nilakottai |
Nilakottai |
5 |
306.80 |
|
|
|
Total |
14 |
1114.21 |
2.4.2. Block wise channel abstract (Direct Ayacut)
| S. No |
District |
Block |
Taluk |
No.ofTanks |
Direct Ayacut in ha |
| 1. |
Theni |
Periyakulam |
Periyakulam |
1 |
118.580 |
| 2. |
Dindigul |
Batlagundu |
Nilakottai |
6 |
309.540 |
| 3. |
Dindigul |
Nilakottai |
Nilakottai |
1 |
92.890 |
| 4. |
Dindigul |
Authoor |
Authoor |
3 |
1944.120 |
|
|
|
Total |
11 |
2465.13 |
2.4.3. Block wise Anicut Abstract (Direct Ayacut channels)
| S. No |
District |
Block |
Taluk |
No.ofAnicuts |
Total Ayacutin ha |
| 1. |
Theni |
Periyakulam |
Periyakulam |
2 |
256.74 |
|
|
|
Total |
2 |
256.74 |
2.4.4. Total Abstract
| S. No |
Particulars |
Area (ha) |
| 1. |
Tank Ayacut |
1114.211 |
| 2. |
AnicutAyacut ( Direct) |
2465.130 |
| 3. |
Direct Ayacut through channels |
256.74 |
|
Total Ayacut |
3836.081 |
2.5. Land use Classification:
At entire portion of Periyakulam &Authoor, Nilakottai are Paddy, Sugarcane, small Cholam, Groundnut, Coconut plantation.
2.6. Ground water potential;
- In general ground water potential is good to very good
- Periyakulam Block - Red and Clay soils
- Authoor Block - Red soils
- Batlagundu Block - Red soils
- Nilakottai Block - Red soils
2.7. Gauging stations in CWC & PWD
The Hydro Meteorology parameters include rainfall, temperature, humidity, wind velocity, evaporation and duration of sun shine which determine the climate of the basin. As per PWD(GW), Viralipatti , the following details are furnished.
- Maximum temperature - 31.43 c
- Minimum temperature - 25.70 c
- Average temperature - 28.56 c
- RH - 65.49
- Average wind speed - 1.85 to 8.10 KM/ph
- Sun shine - 6.70 to 7.5 H/day
| 2.7.1. TN-IAMP Manjalar Sub Basin Block Wise Channel List |
| Sl.No |
Name of basin |
Name of sub basin |
Name of the channel |
Block |
Registered ayacut in ha |
Partially irrigated ha |
Fully irrigated ha |
Gap ha |
Total |
District |
| 1 |
Vaigai |
Manjalar |
Puduanicut channel |
Periyakulam |
118.580 |
35.57 |
34.39 |
48.62 |
118.58 |
Theni |
| 2 |
Vaigai |
Manjalar |
Kanavoipattianicut channel |
Batlagundu |
41.690 |
17.510 |
14.590 |
9.590 |
41.690 |
Dindigul |
| 3 |
Vaigai |
Manjalar |
Periyakulamanicut channel |
Batlagundu |
47.910 |
17.250 |
15.810 |
14.850 |
47.910 |
Dindigul |
| 4 |
Vaigai |
Manjalar |
Pilathuanicut channel |
Batlagundu |
46.810 |
18.260 |
18.250 |
10.300 |
46.810 |
Dindigul |
| 5 |
Vaigai |
Manjalar |
Kunnuvarayananicut channel |
Batlagundu |
94.180 |
27.310 |
27.310 |
39.560 |
94.180 |
Dindigul |
| 6 |
Vaigai |
Manjalar |
Perumalkovilanicut channel |
Batlagundu |
39.270 |
12.170 |
14.530 |
12.570 |
39.270 |
Dindigul |
| 7 |
Vaigai |
Manjalar |
Siruvankulamanicut channel |
Batlagundu |
39.680 |
16.670 |
13.890 |
9.130 |
39.690 |
Dindigul |
| 8 |
Vaigai |
Manjalar |
Alankulamanicut channel |
Nilakottai |
92.890 |
28.800 |
34.370 |
29.720 |
92.890 |
Dindigul |
| 9 |
Vaigai |
Manjalar |
Ayyampalayamanicut channel |
Authoor |
263.560 |
110.700 |
76.430 |
76.430 |
263.560 |
Dindigul |
| 10 |
Vaigai |
Manjalar |
LMC of Marudhanadhi Dam |
Authoor |
1026.720 |
359.350 |
297.750 |
369.620 |
1026.720 |
Dindigul |
| 11 |
Vaigai |
Manjalar |
RMC of Marudhanadhi Dam |
Authoor |
653.840 |
248.460 |
215.770 |
189.610 |
653.840 |
Dindigul |
|
|
|
|
Total |
2465.130 |
892.050 |
763.090 |
809.990 |
2465.130 |
|
| 2.7.2. TN-IAMP Manjalar Sub Basin Block Wise Tank Abstract |
| Sl.No |
Name of basin |
Name of sub basin |
Block |
No.of Tanks |
Registered ayacut in Ha |
Partially irrigated Ha |
Fully irrigated Ha |
Gap Ha |
Total |
District |
| 1 |
Vaigai |
Manjalar |
Periyakulam |
1 |
64.780 |
22.670 |
16.200 |
25.910 |
64.780 |
Theni |
| 2 |
Vaigai |
Manjalar |
Batlagundu |
5 |
306.800 |
125.400 |
89.190 |
92.210 |
306.800 |
Dindigul |
| 3 |
Vaigai |
Manjalar |
Nilakottai |
2 |
65.350 |
24.150 |
20.340 |
20.860 |
65.350 |
Dindigul |
| 4 |
Vaigai |
Manjalar |
Authoor |
6 |
677.281 |
273.030 |
191.900 |
212.351 |
677.281 |
Dindigul |
|
|
|
Total |
14 |
1114.211 |
445.250 |
317.630 |
351.331 |
1114.211 |
|
| 2.7.3.Block Wise Channel Abstract |
| Sl. No |
Name of basin |
Name of sub basin |
Block |
No.of Channel |
Registered ayacut in ha |
Partially irrigated ha |
Fully irrigated ha |
Gap ha |
Total |
District |
| 1 |
Vaigai |
Manjalar |
Periyakulam |
1 |
118.580 |
35.570 |
34.390 |
48.620 |
118.580 |
Theni |
| 2 |
Vaigai |
Manjalar |
Batlagundu |
6 |
309.540 |
109.170 |
104.390 |
95.980 |
309.540 |
Dindigul |
| 3 |
Vaigai |
Manjalar |
Nilakottai |
1 |
92.890 |
28.800 |
34.370 |
29.720 |
92.890 |
Dindigul |
| 4 |
Vaigai |
Manjalar |
Authoor |
3 |
1944.120 |
718.500 |
589.940 |
635.680 |
1944.120 |
Dindigul |
|
|
|
Total |
11 |
2465.130 |
892.040 |
763.090 |
810.000 |
2465.130 |
|
| 2.7.4.Block Wise Anicut Abstract |
| Sl. No |
Name of basin |
Name of sub basin |
Block |
No. of Anicut |
Registered ayacut in Ha |
Partially irrigated Ha |
Fully irrigated Ha |
Gap Ha |
Total |
District |
| 1 |
Vaigai |
Manjalar |
Periyakulam |
2 |
256.740 |
102.890 |
65.580 |
88.270 |
256.740 |
Theni |
|
|
|
|
|
|
|
|
|
|
|
2.7.5. TN-IAMP Manjalar Sub Basin Block Wise Anicut list
| Sl.No |
Name of basin |
Name of sub basin |
Name of Anicut |
Benfifted Blocks |
Registered ayacut in Ha |
Partially irrigated Ha |
Fully irrigated Ha |
Gap Ha |
Total |
District |
| 1 |
Vaigai |
Manjalar |
Nagarvalli |
Periyakulam |
138.160 |
56.650 |
27.630 |
53.880 |
138.160 |
Theni |
| 2 |
Vaigai |
Manjalar |
PuduAnaicut |
Periyakulam |
118.580 |
46.250 |
37.950 |
34.390 |
118.590 |
Theni |
|
|
|
|
Total for Anicut including Channel |
256.740 |
102.900 |
65.580 |
88.270 |
256.750 |
|
2.7.6. TN-IAMP Manjalar Sub Basin Block Wise River List
| Sl. No |
Name of River |
District |
Block |
Taluk |
| 1 |
Manjalar River |
Theni&Dindigul |
Periyakulam, Batlagundu, Nilakottai |
Periyakulam, Nilakottai |
| 2 |
Marudhanathi River |
Dindigul |
Authoor&Batlagundu. |
Authoor, Nilakottai |
2.7.7.Details of WRD Infrastructure with Unicode Nos
| Sl.No. |
Unicode |
Name of Tank / Anicut / Supply Channel |
Village |
Block |
Taluk |
District |
Ayacut in Ha |
| FI |
PI |
Gap |
Total |
| 1 |
|
Patchilainatchiamman tank |
G.kallupatty |
Periyakulam |
Periyakulam |
Theni |
16.2 |
22.67 |
25.91 |
64.78 |
| 2 |
TNVG-06-T0015 |
Veerankulam tank |
Batlagundu |
Batlagundu |
Nilakottai |
Dindigul |
22.26 |
26.98 |
18.21 |
67.45 |
| 3 |
TNVG-06-T0021 |
Vedakulam tank |
Batlagundu |
Batlagundu |
Nilakottai |
Dindigul |
2.25 |
3.42 |
4.1 |
9.77 |
| 4 |
TNVG-06-T0049 |
KunnavarayankottaiPeriyakanmoi tank |
Kunnavarayankottai |
Batlagundu |
Nilakottai |
Dindigul |
22.55 |
31.1 |
24.11 |
77.76 |
| 5 |
TNVG-06-T0043 |
Alangulam |
Sivaganapuram |
Nilakottai |
Nilakottai |
Dindigul |
6.36 |
10.16 |
8.9 |
25.42 |
| 6 |
TNVG-06-T0045 |
Sirukulam |
Sivaganapuram |
Nilakottai |
Nilakottai |
Dindigul |
13.98 |
13.97 |
11.98 |
39.93 |
| 7 |
TNVG-06-T0008 |
Thamaraikulam |
Ayyampalayam |
Authhor |
Authoor |
Dindigul |
69.94 |
99.92 |
79.94 |
249.8 |
| 8 |
TNVG-06-T0007 |
karunkulam |
Sitharevu |
Authoor |
Authoor |
Dindigul |
39.02 |
57.81 |
47.69 |
144.52 |
| 9 |
TNVG-09-T0938 |
Rengasamudram |
Sitharevu |
Authoor |
Authoor |
Dindigul |
12.7 |
17.86 |
9.13 |
39.69 |
| 10 |
TNVG-06-T0010 |
Sottankulam |
Sitharevu |
Authoor |
Authoor |
Dindigul |
8.73 |
17.14 |
5.3 |
31.17 |
| 11 |
TNVG-06-T0011 |
Gopalasamudram |
Sevugampatti |
Batlagundu |
Nilakottai |
Dindigul |
25.6 |
35.3 |
27.36 |
88.26 |
| 12 |
TNVG-06-T0033 |
Siruvankulam |
Komaipatti |
Batlagundu |
Nilakottai |
Dindigul |
16.53 |
28.6 |
18.43 |
63.56 |
| 13 |
TNVG-06-T0002 |
Puliyankulam |
Sitharevu |
Authoor |
Authoor |
Dindigul |
43.92 |
53.011 |
54.52 |
151.451 |
| 14 |
TNVG-06-T0001 |
Narasingapuram -Thamaraikulam |
Narasingapuram |
Authoor |
Authoor |
Dindigul |
17.59 |
27.29 |
15.77 |
60.65 |
| Anaicuts |
| 1 |
|
Nagarvallianicut |
Devathanapatty |
Periyakulam |
Periyakulam |
Theni |
27.63 |
56.65 |
53.88 |
138.16 |
| 2 |
|
Puduanicut |
Genguvarpatty |
Periyakulam |
Periyakulam |
Theni |
37.95 |
46.24 |
34.39 |
118.58 |
| Supply Channels |
| 1 |
|
Puduanicut channel |
Genguvarpatti |
Periyakulam |
Periyakulam |
Theni |
34.39 |
35.57 |
48.62 |
118.58 |
| 2 |
|
Kanavoipattianicut channel |
Kanavoipatti |
Batlagundu |
Nilakottai |
Dindigul |
14.59 |
17.51 |
9.59 |
41.69 |
| 3 |
|
Periyakulamanicut channel |
Batlagundu |
Batlagundu |
Nilakottai |
Dindigul |
15.81 |
17.25 |
14.85 |
47.91 |
| 4 |
|
Pilathuanicut channel |
Batlagundu |
Batlagundu |
Nilakottai |
Dindigul |
18.26 |
18.25 |
10.3 |
46.81 |
| 5 |
|
Kunnuvarayankottaianicut channel |
Kunnavarayankottai |
Batlagundu |
Nilakottai |
Dindigul |
27.31 |
27.31 |
39.56 |
94.18 |
| 6 |
|
Alangulamanicut channel |
Sivaganapuram |
Nilakottai |
Nilakottai |
Dindigul |
34.37 |
28.8 |
29.72 |
92.89 |
| 7 |
|
Ayyampalayamanicut channel |
Ayyampalayam |
Authoor |
Authoor |
Dindigul |
76.43 |
110.7 |
76.43 |
263.56 |
| 8 |
|
Perumalkovilanicut channel |
Sevugampatti |
Authoor |
Authoor |
Dindigul |
14.53 |
12.17 |
12.57 |
39.27 |
| 9 |
|
Siruvankulamanicut channel |
Komaipatti |
Authoor |
Authoor |
Dindigul |
13.89 |
16.66 |
9.13 |
39.68 |
| 10 |
|
LMC of Marudhanadhi Dam |
Ayyampalayam |
Authoor |
Authoor |
Dindigul |
297.75 |
359.35 |
369.62 |
1026.72 |
| 11 |
|
RMC of Marudhanadhi Dam |
Ayyampalayam |
Authoor |
Authoor |
Dindigul |
215.77 |
248.46 |
189.61 |
653.84 |
|
|
|
|
|
|
|
|
|
|
3836.08 |
3. Cropping pattern:
Manjalar Sub Basin -Cropping Pattern: (Dindigul District)
| Name of the sub Basin |
MANJALAR |
Fully Irrigated |
: |
1030.14 |
ha |
| Nodal District |
DINDIGUL |
Partially Irrigated |
: |
1279.06 |
ha |
| Registered Ayacut Area |
3396.00Ha |
Gap |
: |
1086.82 |
ha |
|
|
Total Ayacut Area |
: |
3396.02 |
ha |
| S.No |
Crop |
Without Project |
With Project |
Increasing |
| FI |
PI |
RF/G |
Total |
FI |
PI |
RF/G |
Total |
| I |
Perennial crop |
|
|
|
|
|
|
|
|
| 1 |
Coconut |
306.00 |
534.00 |
0.00 |
840.00 |
890.00 |
0.00 |
0.00 |
890.00 |
50.00 |
| 2 |
Mango |
42.00 |
169.00 |
0.00 |
211.00 |
492.00 |
0.00 |
0.00 |
492.00 |
281.00 |
| 3 |
Amla |
15.00 |
5.54 |
0.00 |
20.54 |
23.54 |
0.00 |
0.00 |
23.54 |
3.00 |
| 4 |
Moringa |
15.97 |
15.00 |
0.00 |
30.97 |
44.97 |
0.00 |
0.00 |
44.97 |
14.00 |
| 5 |
Sapota |
14.19 |
4.40 |
0.00 |
18.59 |
25.59 |
0.00 |
0.00 |
25.59 |
7.00 |
| 6 |
Citrus |
1.00 |
0.00 |
0.00 |
1.00 |
3.00 |
0.00 |
0.00 |
3.00 |
2.00 |
| 7 |
Jasmine |
6.69 |
8.95 |
0.00 |
15.64 |
20.24 |
0.00 |
0.00 |
20.24 |
4.60 |
|
Total |
400.85 |
736.89 |
0.00 |
1137.74 |
1499.34 |
0.00 |
0.00 |
1499.34 |
361.60 |
| II |
Annual Crop |
| 1 |
Sugarcane |
0.00 |
0.00 |
0.00 |
0.00 |
0.00 |
0.00 |
0.00 |
0.00 |
0.00 |
| 2 |
Banana |
57.00 |
0.00 |
0.00 |
57.00 |
72.00 |
0.00 |
0.00 |
72.00 |
15.00 |
| 3 |
T.C. Banana |
0.00 |
0.00 |
0.00 |
0.00 |
0.00 |
0.00 |
0.00 |
0.00 |
0.00 |
|
Total |
57.00 |
0.00 |
0.00 |
57.00 |
72.00 |
0.00 |
0.00 |
72.00 |
15.00 |
| III |
1st crop |
|
|
|
|
|
|
|
|
|
| 1. a |
Paddy |
340.00 |
0.00 |
0.00 |
340.00 |
0.00 |
0.00 |
0.00 |
0.00 |
0.00 |
| b |
Paddy - SRI |
35.00 |
0.00 |
0.00 |
35.00 |
375.00 |
0.00 |
0.00 |
375.00 |
0.00 |
| 2 |
Maize |
87.85 |
24.00 |
0.00 |
111.85 |
804.85 |
0.00 |
0.00 |
804.85 |
693.00 |
| 3 |
Pulses |
35.00 |
166.33 |
0.00 |
201.33 |
283.34 |
0.00 |
0.00 |
283.34 |
82.01 |
| 4 |
Groundnut |
0.00 |
0.00 |
0.00 |
0.00 |
107.00 |
0.00 |
0.00 |
107.00 |
107.00 |
| 5 |
Cumbu |
25.00 |
22.00 |
0.00 |
47.00 |
0.00 |
0.00 |
0.00 |
0.00 |
-47.00 |
| 6 |
cholam |
35.00 |
285.00 |
0.00 |
320.00 |
0.00 |
0.00 |
0.00 |
0.00 |
-320.00 |
| 7 |
Gingilly |
0.00 |
15.00 |
0.00 |
15.00 |
15.00 |
0.00 |
0.00 |
15.00 |
0.00 |
| 8 |
Cotton |
15.00 |
30.00 |
0.00 |
45.00 |
65.00 |
0.00 |
0.00 |
65.00 |
20.00 |
| 9 |
Gourds |
0.00 |
0.00 |
0.00 |
0.00 |
0.00 |
0.00 |
0.00 |
0.00 |
0.00 |
| 10 |
Radish |
0.00 |
0.00 |
0.00 |
0.00 |
0.00 |
0.00 |
0.00 |
0.00 |
0.00 |
| 11 |
Curry leaf |
0.00 |
0.00 |
0.00 |
0.00 |
0.00 |
0.00 |
0.00 |
0.00 |
0.00 |
| 12 |
Cluster Beans |
0.00 |
0.00 |
0.00 |
0.00 |
0.00 |
0.00 |
0.00 |
0.00 |
0.00 |
| 13 |
Greens |
0.00 |
0.00 |
0.00 |
0.00 |
0.00 |
0.00 |
0.00 |
0.00 |
0.00 |
| 14 |
Watermelon |
0.00 |
0.00 |
0.00 |
0.00 |
0.00 |
0.00 |
0.00 |
0.00 |
0.00 |
| 15 |
Tapiaco |
0.00 |
0.00 |
0.00 |
0.00 |
0.00 |
0.00 |
0.00 |
0.00 |
0.00 |
| 16 |
Chillies |
0.00 |
0.00 |
0.00 |
0.00 |
0.00 |
0.00 |
0.00 |
0.00 |
0.00 |
| 17 |
Beans |
0.00 |
0.00 |
0.00 |
0.00 |
0.00 |
0.00 |
0.00 |
0.00 |
0.00 |
| 18 |
Veg Cowpea |
0.00 |
0.00 |
0.00 |
0.00 |
0.00 |
0.00 |
0.00 |
0.00 |
0.00 |
| 19 |
Coriander |
0.00 |
0.00 |
0.00 |
0.00 |
0.00 |
0.00 |
0.00 |
0.00 |
0.00 |
|
| 20 |
Crossandra |
0.00 |
0.00 |
0.00 |
0.00 |
0.00 |
0.00 |
0.00 |
0.00 |
0.00 |
| 21 |
Fodder Cholam |
0.00 |
0.00 |
0.00 |
0.00 |
0.00 |
0.00 |
0.00 |
0.00 |
0.00 |
| 22 |
Fallow |
0.00 |
0.00 |
1086.82 |
1086.82 |
0.00 |
0.00 |
0.00 |
1086.82 |
1086.82 |
|
Total |
572.85 |
542.33 |
1086.82 |
2202.00 |
1650.19 |
0.00 |
0.00 |
2737.01 |
1621.83 |
|
Grand Total (I+II+III) |
1030.7 |
1279.2 |
1086.82 |
3396.74 |
3221.53 |
0.00 |
0.00 |
4308.35 |
1998.43 |
| IV |
2 nd crop |
|
|
|
|
|
|
|
|
|
| 1. a |
Paddy |
0.00 |
0.00 |
0.00 |
0.00 |
0.00 |
0.00 |
0.00 |
0.00 |
0.00 |
| b |
Paddy - SRI |
0.00 |
0.00 |
0.00 |
0.00 |
0.00 |
0.00 |
0.00 |
0.00 |
0.00 |
| 2 |
Maize |
0.00 |
0.00 |
0.00 |
0.00 |
0.00 |
0.00 |
0.00 |
0.00 |
0.00 |
| 3 |
Pulses |
0.00 |
0.00 |
0.00 |
0.00 |
0.00 |
0.00 |
0.00 |
0.00 |
0.00 |
| 4 |
Groundnut |
0.00 |
0.00 |
0.00 |
0.00 |
0.00 |
0.00 |
0.00 |
0.00 |
0.00 |
| 5 |
Bhendi |
0.00 |
0.00 |
0.00 |
0.00 |
0.00 |
0.00 |
0.00 |
0.00 |
0.00 |
|
Total |
0.00 |
0.00 |
0.00 |
0.00 |
0.00 |
0.00 |
0.00 |
0.00 |
0.00 |
| V |
3rd crop |
|
|
|
|
|
|
|
|
|
| 1. a |
Paddy |
0.00 |
0.00 |
0.00 |
0.00 |
0.00 |
0.00 |
0.00 |
0.00 |
0.00 |
| b |
Paddy - SRI |
0.00 |
0.00 |
0.00 |
0.00 |
0.00 |
0.00 |
0.00 |
0.00 |
0.00 |
| 2 |
Pulses |
0.00 |
0.00 |
0.00 |
0.00 |
375.00 |
0.00 |
0.00 |
375.00 |
375.00 |
| 3 |
Groundnut |
0.00 |
0.00 |
0.00 |
0.00 |
0.00 |
0.00 |
0.00 |
0.00 |
0.00 |
|
Total |
0.00 |
0.00 |
0.00 |
0.00 |
375.00 |
0.00 |
0.00 |
375.00 |
0.00 |
|
Grand Total |
1030.7 |
1279.2 |
1086.82 |
3396.74 |
3221.53 |
0.00 |
0.00 |
4683.35 |
-175.21 |
|
Cropping Intensity |
|
|
|
100 % |
|
|
|
137.88% |
|
3.1. Area Production and Productivity: Block-Nilakottai
| Sl. No. |
Crop |
Without Project |
With Project |
| Area (Ha.) |
Production (MT.) |
Productivity (MT./Ha.) |
Area (Ha.) |
Production (MT.) |
Productivity (MT./Ha.) |
| 1 |
Paddy |
18 |
85.50 |
4.750 |
25 |
162.50 |
6.500 |
|
Total |
18 |
85.50 |
4.750 |
25 |
162.50 |
6.500 |
3.2. Crop Wise Production and Total Income: Block-Nilakottai
| Sl. No. |
Crop |
Without Project |
With Project |
Additional |
| Total Production (MT.) |
Total Return (L.Rs.) |
Total Production (MT.) |
Total Return (L.Rs.) |
Production (MT.) |
Return (L.Rs.) |
| 1 |
Paddy |
85.50 |
12.825 |
162.50 |
24.375 |
77.00 |
11.550 |
|
Total |
85.50 |
12.825 |
162.50 |
24.375 |
77.00 |
11.550 |
Area Production and Productivity: Block- Batlagundu
| Sl. No. |
Crop |
Without Project |
With Project |
| Area (Ha.) |
Production (MT.) |
Productivity (MT./Ha.) |
Area (Ha.) |
Production (MT.) |
Productivity (MT./Ha.) |
| 1 |
Paddy |
158 |
750.5 |
4.750 |
189 |
1228.5 |
6.500 |
|
Total |
158 |
750.5 |
4.750 |
189 |
1228.5 |
6.500 |
Crop Wise Production and Total Income: Block- Batlagundu
| Sl. No. |
Crop |
Without Project |
With Project |
Additional |
| Total Production (MT.) |
Total Return (L.Rs.) |
Total Production (MT.) |
Total Return (L.Rs.) |
Production (MT.) |
Return (L.Rs.) |
| 1 |
Paddy |
750.5 |
112.575 |
1228.5 |
184.275 |
478.0 |
71.7 |
|
Total |
750.5 |
112.575 |
1228.5 |
184.275 |
478.0 |
71.7 |
3.5. Specific issues
- Non adoption of SRI in rice and low productivity per unit area
- Lack of crop diversification
- Low productivity of pulses
- Lack of usage of modernized farm implements
- Lack of awareness about seed production techniques
- Lack of awareness of precision farming systems
3.6. Counter measures proposed
- Introduction of system of rice intensification
- Precision farming in vegetables and flowers to improve productivity
- Practicing seed production techniques in rice and pulses
3.7. Objectives
- To enhance the crop and water productivity
- To promote water saving technologies and mechanization in agriculture
- To increase the cropped area by crop diversification
- To converge with line departments in overall improvement in total farm income
4. Field interventions
To address the special issues (prevalent in the sub basin), the counter measures proposed through project mode and mission mode approaches are:
- Green Manure+SRI
- IPT in GL pulses
- Quality seed production
- Improved production technologies in oil seeds
- Precision farming in vegetables and flowers
4.1. Green manure +SRI
Scientific management techniques of allocating irrigation water, based on soil and climatic condition to achieve maximum crop production per unit of water applied over a unit area in unit time is very much essential under the present condition. System of Rice Intensification (SRI) is one of the scientific management tools to save the water and increases the productivity in rice cultivation.
Under conventional system of rice cultivation, poor water management and continuous flooding of water resulted with poor aeration, root activity, tiller production and finally low production. Mismanagement of water also increases the wastage of water in command areas. The low yield of rice also will be due to poor weed management that increased the competition between crop and weeds. SRI does not require the purchase of new seeds or use of new high – yielding varieties. SRI requires only skillful management of the factors of production. Square planting ensures weeding operation in either direction. Rotary weeder operation incorporates the weed biomass and aerates the soil for better root activity and tillering. Efficient water management reduces the irrigation water requirement.
| S. No. |
Technology |
Area(ha) |
Unit cost(Rs.) |
Total cost(Rs. In lakhs) |
| 1. |
Green manure – Rice |
200 |
8000 |
16.00 |
Details of unit cost Green Manure
| S. No. |
Particulars |
Amount (Rs.) |
| 1. |
Seed cost 40 kg/ha @ Rs. 50/kg |
2000.00 |
|
Grand Total |
2000.00 |
Details of unit cost Rice
| S. No |
Particulars |
Amount(Rs.) |
| 1 |
Cost of Soil testing |
20.00 |
| 2 |
Seed cost - 10 kg / ha @ Rs.30/kg |
300.00 |
| 3 |
Cost of nursery raising |
- |
| 4 |
Cost of fertilizers (150:50:50 kg NPK / ha) |
|
Urea - 300 kg/ha @ Rs.6 /kg |
1,800.00 |
|
Muriate of Potash – 80 kg @ Rs.16/kg |
1,280.00 |
|
ZnSO4 25 kg @ Rs.40/kg |
1,000.00 |
| 5 |
Bio fertilizer & Bio inoculants |
1,600.00 |
|
Grand Total |
6,000.00 |
Pulse seed production programme: Production of TFL Seeds under farmers’ participatory approach to produce quality pulse seeds
| S. No |
Technology |
Total area (ha) |
Unit cost (Rs./ha) |
Total(In lakhs) |
| 1. |
Production of TFL Seeds under farmers participatory approach to produce quality pulse seeds |
20 |
6000 |
1.20 |
Details of unit cost for TFL pulses
| S. No |
Particulars |
Amount (Rs.) |
| 1. |
Cost of Soil testing |
20.00 |
| 2. |
Seed cost with seed treatment - 20 Kg / Ha @ Rs.150/Kg |
3,000.00 |
| 3. |
DAP 25 Kg / Ha @ Rs.22.50/Kg |
560.00 |
| 4. |
Pulse Wonder 2 Kg/Ha @ Rs.220/Kg |
440.00 |
| 5. |
Cleaning and Packaging of seeds |
1,000.00 |
| 6. |
Bio fertilizers and Bio inoculants |
980.00 |
|
Grand Total |
6,000.00 |
4.3. Area enhancement, area expansion and productivity of Pulses
| S. No |
Technology |
Total area (ha) |
Unit cost(Rs./ha) |
Total(In lakhs) |
| 1. |
Area enhancement, area expansion and productivity of Pulses |
35 |
5000 |
1.75 |
Details of unit cost for Area expansion pulses
| S. No |
Particulars |
Amount(Rs.) |
| 1. |
Cost of Soil testing |
20.00 |
| 2. |
Seed cost with seed treatment - 20 kg / ha @ Rs.150/kg |
3,000.00 |
| 3. |
DAP 25 kg / ha @ Rs.22.50/kg |
560.00 |
| 4. |
Pulse Wonder 2 kg/ha @ Rs.220/kg |
440.00 |
| 5. |
Bio fertilizers and Bio inoculants |
980.00 |
|
Grand Total |
5,000.00 |
4.4. Demonstration of improved production techniques with various oil seed crops with prime focus on improving productivity, encouraging crop diversification
The non monitory input of quality seeds play a major role in maintaining plant population in terms of reflecting on the yield. By technical knowhow and do-how through demonstration for the production and sale of quality seeds can help the farmers to use the recommended quantity of seeds and also source points for seed availability increase.
| S. No |
Technology |
Total area (ha) |
Unit cost (Rs./ha) |
Total (In lakhs) |
| 1. |
Improved production technology in oil seeds |
35 |
5000 |
1.75 |
Details of unit cost for oil seed area promotion:
| S. No |
Particulars |
Amount(Rs.) |
| 1. |
Cost of Soil testing |
20.00 |
| 2. |
Gypsum 400 kg / ha @Rs.5/kg |
2,000.00 |
| 3. |
Fertilizer cost |
1,500.00 |
| 4. |
Pheromone trap and lure for Spodopteralitura |
730.00 |
| 5. |
Micro nutrient spray (DAP–2.5 kg, Ammonium sulphate – 1 kg, Borax – 500 gm and planofix–375 Ml) @ Rs.250 for 3 sprays. |
750.00 |
|
Grand Total |
5,000.00 |
4.4. Production of vegetable under Precision farming mode by adopting of IPM concept
Adoption of high density with drip fertigation in tissue is one of the important technologies to improve the productivity of vegetable. This concept was widely tested in TNAU and High density vegetable with tissue culture is more suitable for drip fertigation to realize higher crop and water productivity.
| S. No |
Technology |
Total Area (ha) |
Unit cost (Rs.) |
Total cost in Lakhs |
| 1. |
Precision farming in vegetables |
14 |
1,20,000 |
16.80 |
Details of unit cost for Vegetables:
| S. No |
Particulars |
Amount (Rs.) |
| 1. |
Drip cost as per the Govt. norms @ 75 % subsidy |
75,000.00 |
| 2. |
Cost of Seed/Seedlings |
25,000.00 |
| 3. |
Water Soluble fertilizers. |
|
19:19:19-100 kg @ Rs.75/kg |
7,500.00 |
|
Urea - 200 kg @ Rs.6/kg |
- |
|
MAP-50 kg @ Rs.90/kg |
4,500.00 |
|
SSP-100kg @ Rs.7.5/kg |
750.00 |
| 4. |
Bio fertilizer |
1,750.00 |
| 5. |
Mulching sheets & Laying |
5,500.00 |
|
Grand Total |
1,20,000.00 |
4.5. Promotion of Pesticide Free Vegetables in sub-basins through climate resilience activity in model Bio Villages known as pesticide free Village
The non-monitory input of quality seeds play a major role in maintaining plant population in terms of reflecting on the yield.
| S. No. |
Technology |
Groups |
Unit cost |
Total cost (Rs. In lakhs) |
| 1. |
Pesticide free Vegetables |
60 |
2500 |
1.50 |
5. Information, Education & Communication (IEC charges) including Awareness creation, documentation and IEC equipment
5. 1. Capacity building
5.1.1. Training to stake holders
Under the head of capacity building, imparting training to all the beneficiaries either as off-campus or as on-campus and exposure visit to the farmers is planned.
| Sl. No. |
Particulars |
Duration (days) |
No/batch |
Total batch |
Budget / batch |
Total budget (lakhs) |
| 1. |
Nursery technology for SRI paddy |
1 |
50 |
5 |
10,000 |
1.00 |
| 2. |
Seed production in Pulses |
1 |
50 |
5 |
10,000 |
1.00 |
| 3. |
Precision farming practices for vegetables |
1 |
50 |
5 |
10,000 |
1.00 |
|
|
|
|
|
Total |
3.00 |
Exposure visit
In-order to have practical knowledge on various improved farming practices prevailing across the District and State, it has been proposed to expose the stakeholders by organizing educational tours for having better cross learning.
5.2. IEC Measures including Awareness creation, documentation and IEC equipment
5.2.1. Awareness Creation:
- Informal meetings with Farmers / Water Users Association through PRA methods – Focus group discussion and transect walk
- Ensure transparency
- Explain about the scheme – organization objectives, activities, project contribution and farmers share
- Emphasis the role of stake holders in the project
- Project the expected benefit
5.2.2. Documentation
- Field note for each activity
- Maintenance of records and registers
- Daily memorandum sheet
- Receipt and issue of inputs
- Technical observations on soil, water and crop
5.2.3. IEC Equipment
- Purchase of Laptop, Camera and computer accessories
5.2.4. Outsourcing of vehicle
- Expenditure on TA /DA for the purpose of TNIAM Project
- Fuel bill of university vehicle utilized for the project
- Hire charges of university vehicle utilized for this purpose.
6. Management Cost
Outsourcing of technical staff is included in TNAU sub basin plan to carry out the field activities.
7. Year Wise Crop Based Activities
| S. No. |
Particulars |
Total (ha) |
| I |
II |
III |
IV |
Area( ha) |
| 1. |
Green Manure-Paddy (SRI) |
50 |
50 |
50 |
50 |
200 |
| 2. |
Production of TFL seeds |
5 |
5 |
5 |
5 |
20 |
| 3. |
Area expansion of pulses (Black gram/ Green gram) |
5 |
10 |
10 |
10 |
35 |
| 4. |
Improved cultivation practices for enhancing production in oilseed crop (Sesame) |
5 |
10 |
10 |
10 |
35 |
| 5. |
Precision farming vegetables |
4 |
5 |
5 |
0 |
14 |
|
|
Total |
69 |
80 |
80 |
75 |
304 |
Total Budget (Year wise) for Manjalar Sub basin
P-Physical in ha, F-Financial in lakh rupees
| S. No |
Particulars |
Unit cost Rs/ha |
I Year |
II Year |
III Year |
IV Year |
V Year |
VI Year |
Total |
| I |
A. Field Activities |
P |
F |
P |
F |
P |
F |
P |
F |
P |
F |
P |
F |
P |
F |
| 1 |
GM-SRI |
8000 |
50 |
4.00 |
50 |
4.00 |
50 |
4.00 |
50 |
4.00 |
0 |
0.00 |
0 |
0.00 |
200 |
16.00 |
| 2 |
Pulse seed production programme : Production of TFL Seeds under farmers participatory approach to produce quality pulse seeds |
6000 |
5 |
0.30 |
5 |
0.30 |
5 |
0.30 |
5 |
0.30 |
0 |
0.00 |
0 |
0.00 |
20 |
1.20 |
| 3 |
Area Enhancement, Area Expansion and productivity enhancement of pulses under crop diversification in gap areas: (Black gram/green gram) |
5000 |
5 |
0.25 |
10 |
0.50 |
10 |
0.50 |
10 |
0.50 |
0 |
0.00 |
0 |
0.00 |
35 |
1.75 |
| 4 |
Demonstration of improved production techniques with various oil seed crops with prime focus on improving productivity, encouraging crop diversification |
5000 |
5 |
0.25 |
10 |
0.50 |
10 |
0.50 |
10 |
0.50 |
0 |
0.00 |
0 |
0.00 |
35 |
1.75 |
| 5 |
Production of vegetable under precision farming mode by adopting of IPM concept. |
120000 |
4 |
4.80 |
5 |
6.00 |
5 |
6.00 |
0 |
0.00 |
0 |
0.00 |
0 |
0.00 |
14 |
16.80 |
| 6 |
Promotion of Pesticide Free Vegetables in sub-basins through climate resilience activity in model Bio Villages known as Pesticide Free Village |
2500 |
15 |
0.38 |
15 |
0.38 |
15 |
0.37 |
15 |
0.37 |
0 |
0.00 |
0 |
0.00 |
60 |
1.50 |
| B |
Farm implements |
|
|
|
|
|
|
|
|
|
|
|
|
|
|
| 7 |
Conoweeder |
1000 |
50 |
0.50 |
50 |
0.50 |
50 |
0.50 |
50 |
0.50 |
0 |
0.00 |
0 |
0.00 |
200 |
2.00 |
|
Total (A+B) |
|
134 |
10.48 |
145 |
12.18 |
145 |
12.17 |
140 |
6.17 |
0 |
0.00 |
0 |
0.00 |
564 |
41.00 |
| II |
IEC & CB |
|
|
|
|
|
|
|
|
|
|
|
|
|
|
|
| 1 |
Training to stakeholders |
|
|
1.00 |
|
1.00 |
|
0.50 |
|
0.50 |
|
0.00 |
|
0.00 |
|
3.00 |
| 2 |
Exposure visit |
|
|
0.50 |
|
0.50 |
|
0.25 |
|
0.25 |
|
0.00 |
|
0.00 |
|
1.50 |
| 3 |
Awareness creation |
|
|
0.50 |
|
0.50 |
|
0.25 |
|
0.25 |
|
0.00 |
|
0.00 |
|
1.50 |
| 4 |
Documentation |
|
|
0.40 |
|
0.40 |
|
0.10 |
|
0.10 |
|
0.10 |
|
0.20 |
|
1.30 |
| 5 |
IEC equipment |
|
|
0.75 |
|
0.00 |
|
0.00 |
|
0.00 |
|
0.00 |
|
0.00 |
|
0.75 |
| 6 |
Out sourcing of Vehicle and TA |
|
|
0.65 |
|
0.65 |
|
0.65 |
|
0.65 |
|
0.30 |
|
0.30 |
|
3.20 |
|
Total |
|
|
3.80 |
|
3.05 |
|
1.75 |
|
1.75 |
|
0.40 |
|
0.50 |
|
11.25 |
| III |
Management cost |
|
|
|
|
|
|
|
|
|
|
|
|
|
|
|
| 1 |
Out sourcing of Technical Staff |
|
|
1.26 |
|
1.52 |
|
1.39 |
|
0.82 |
|
0.00 |
|
0.00 |
|
4.99 |
|
Over all Total |
|
|
15.54 |
|
16.75 |
|
15.31 |
|
8.74 |
|
0.40 |
|
0.50 |
|
57.24 |
Manjalar sub-basin Abstract
| S.No |
Intervention details |
Unit cost Rs/ha |
P |
F |
| I |
A. Field Interventions |
|
|
|
| 1 |
GM-SRI |
8000 |
200 |
16.00 |
| 2 |
Pulse seed production programme : Production of TFL Seeds under farmers participatory approach to produce quality pulse seeds |
6000 |
20 |
1.20 |
| 3 |
Area Enhancement, Area Expansion and productivity enhancement of pulses under crop diversification in gap areas: |
5000 |
35 |
1.75 |
| 4 |
Demonstration of improved production techniques with various oil seed crops with prime focus on improving productivity, encouraging crop diversification |
5000 |
35 |
1.75 |
| 5 |
Production of vegetable under precision farming mode by adopting of IPM concept. |
120000 |
14 |
16.80 |
| 6 |
Promotion of Pesticide freevegetables in sub-basins through climate resilience activity in model Bio Villages known as pesticide free Village. |
2500 |
60 |
1.50 |
|
B. Implements for farm mechanization |
|
|
|
| 7 |
Conoweeder |
1000 |
200 |
2.00 |
|
Sub Total (A+B) |
|
564 |
41.00 |
| II |
IEC & CB |
|
|
|
| 1 |
Capacity Building |
|
|
|
|
a). Training to stake holders |
|
|
3.00 |
|
b).Exposure visit |
|
|
1.50 |
| 2 |
IEC |
|
|
|
|
a).Awareness Creation activities |
|
|
1.50 |
|
b).Documentation |
|
|
1.30 |
|
c).IEC equipments |
|
|
0.75 |
|
d) Outsourcing of vehicle and TA |
|
|
3.20 |
|
Sub Total |
|
|
11.25 |
| III |
Management cost |
|
|
|
| 1 |
Out sourcing of technical staff |
|
|
4.99 |
|
Over all Total (I+II+III) |
|
|
57.24 |