Sirumalaiyar
1. Introduction
1.1. About the Implementing centre
The Agricultural College and Research Institute, Madurai is the second Agricultural College of Tamil Nadu State established in the year 1965. It became constituent unit of Tamil Nadu Agricultural University since 1971.The College is functioning with the three fold mandate of Teaching, Research and Extension and Transfer of Technology.
Noteworthy varietal release in the 50 years of research in Agricultural crops include 6 Paddy varieties (MDU 1 to 6), 1 Black gram variety (MDU 1), 1 Kolingi variety (MDU 1),Barnyard millet ACM 10-145 and ACM 10-082.
The newly released blackgram variety MDU 1 released during 2014 possess good battering quality with high arabinogalactone. It is suitable for Idli making along with TRY-3 rice variety. This combination attracted the stake holders for export.
The varieties released in Horticultural crops include MDU 1 Brinjal, Snake gourd, Bitter gourd, Chrysanthemum and Marigold. Madurai-1 Chilli (1975), Madurai-1 Onion (1977), Madurai-1 Bhendi (1978), MDU1 Brinjal (1979), MDU 1 Snakegourd (1981), MDU 1 Bittergourd (1984), MDU 1 Chrysanthemum (1985) and MDU 1 Marigold (1986) and Cluster Bean (2014) were also released by the Institute
2. About the Basin
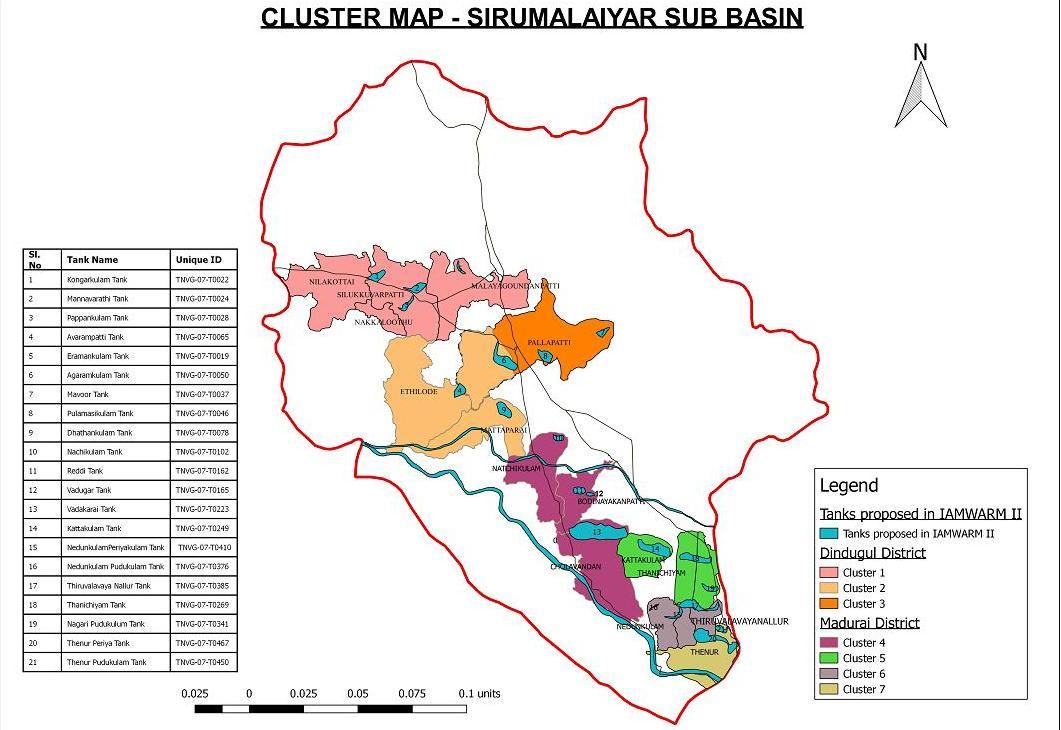
Sirumalaiyar has its origin in the sirumalai situated in Dindigul district of Tamil Nadu. Being the home to several medicinal plants and native tribal population, sirumalai is one of the important biodiversity rich mountains in Dindigul district. The basin of sirumalaiyar starts from this hill and divided into many tributaries. It flows not only through Dindigul district but it has its tributaries uptoVadipatti and Sholavandhan blocks of Madurai and on the way fill many of the tanks in both the districts.
Hence, the tanks which are coming under the basin are situated both in Dindigul and Madurai districts. There are 21 tanks altogether in both Dindigul and Madurai districts of the basin. The total ayacut area of the basin is 3325.87 ha and the details of fully, partially irrigated and the gap area is given below
| Total ayacut area | 3325.87 ha |
| Fully irrigated | 1126.66 ha |
| Partially irrigated | 889.93 ha |
| Gap Area | 1309.28 ha |
There are two clusters in Dindigul district and three clusters in Madurai district under Sirumalaiyar basin.
Silukkuvarpatti cluster of Dindigul district is located in Nilakottai block under which there are three villages namely Silukuvarpatti, Nakkaluthu and Malayalagondanpatty are located. There are four tanks in Silukkuvarpatti clusters namely Kongarkulam, Manavarathi, Pappankulam and Eramankulam
Pallapatti cluster of Dindigul district is located in Nilakottai block under which there are three villages namely Ethilodu, Pallapatti and Mattaparai are present. There are five tanks in Pallapatti cluster namely Avarampatti, Agaramkulam, Pulamasikulam, Mavoor Tank and Dhathankulam
Sholavandhan cluster of Madurai district is located in Vadipatti block which comprises of three villages namely Nachikulam, Bodinayakanpatti and Sholavandhan. There are four tanks namely Nachikulam Tank, Reddi Tank, Vadugar Tank and Vadakarai Tank situated in the cluster.
Thanichiyam cluster of Madurai district is located in Vadipatti and Alanganallur blocks wherein three villages are situated namely Kattakulam, Thanichiyam and Thiruvalavayanallur. The tanks which are present in Thanichiyam cluster are Kattakulam Tank, Thanichiyam Tank, NagariPudhukulam Tank and Thiruvalavayanallur Tank
Nedunkulam cluster of Madurai district is located in Vadipatti and Madurai West Block and the villages which are situated in this cluster are Nedunkulam and Thenur. The tanks namely NedunkulamPudhukulam, Nedunkulam Periyakulam, ThenurPudhukulam Tank and ThenurPeriyakulam tanks are present in this cluster.The consolidated details of district, name of the tanks and name of the cluster village along with total ayacut area is given below in the table
2.1. Tank-wise total ayacut area in Sirumalaiyar sub basin
| Sl.No. | Name of District | Name of Tank | Ayacutin ha | Name of Village | Cluster Village |
|---|---|---|---|---|---|
| CLUSTER I | |||||
| 1 | Dindigul | Kongarkulam | 60.91 | Nilakottai | Silukkuvarpatti |
| 2 | Manavarathi | 79.40 | Silukkuvarpatti | ||
| 3 | Pappankulam | 58.20 | Nakkaluthu | ||
| 4 | Eramankulam | 63.50 | Malayagoundanpatti | ||
| CLUSTER II | |||||
| 5 | Dindigul | Avarampatti | 72.15 | Ethilodu | Pallapatti |
| 6 | Agaramkulam | 290.76 | Pallapatti | ||
| 7 | Pulamasikulam | 75.58 | Pallapatti | ||
| 8 | Mavoor Tank | 178.06 | Pallapatti | ||
| 9 | Dhathankulam | 52.83 | Mattaparai | ||
| CLUSTER III | |||||
| 10 | Madurai | Nachikulam Tank | 127.40 | Nachikulam | Sholavandhan |
| 11 | Reddi Tank | 44.22 | Bodinayakanpatti | ||
| 12 | Vadugar Tank | 24.33 | Bodinayakanpatti | ||
| 13 | Vadakarai Tank | 801.70 | Sholavandhan | ||
| CLUSTER IV | |||||
| 14 | Madurai | Kattakulam Tank | 347.37 | Kattakulam | Thanichiyam |
| 15 | Thanichiyam Tank | 433.20 | Thanichiyam | ||
| 16 | NagariPudhukulam Tank | 36.84 | Thanichiyam | ||
| 17 | Thiruvalavayanallur Tank | 148.80 | Thiruvalavayanallur | ||
| CLUSTER V | |||||
| 18 | Madurai | Nedunkulam Pudhukulam | 43.72 | Nedunkulam | Nedunkulam |
| 19 | Nedunkulam Periyakulam | 60.70 | Nedunkulam | ||
| 20 | Thenur Pudhukulam Tank | 51.82 | Thenur | ||
| 21 | Thenur Periyakulam | 274.38 | Thenur |
The preceding table gives a vivid picture of tanks and total ayacut area under each tank. The following table is comprehensive in terms of fully irrigated, partially irrigated, gap area under each tank in each village.
2.2. Tank wise registered ayacut
| S. No | Name of the tank | Registered ayacut | Fully irrigated | Partially irrigated | Gap area |
|---|---|---|---|---|---|
| 1. | Kongarkulam | 60.91 | 28.62 | 10.96 | 21.33 |
| 2. | Manavarathi | 79.40 | 38.9 | 14.29 | 26.21 |
| 3. | Pappankulam | 58.20 | 29.68 | 11.05 | 17.47 |
| 4. | Eramankulam | 63.50 | 33.02 | 10.79 | 19.69 |
| 5. | Avarampatti | 72.15 | 38.23 | 12.98 | 20.94 |
| 6. | Agaramkulam | 290.76 | 136.65 | 55.24 | 98.87 |
| 7. | Pulamasikulam | 75.58 | 36.27 | 13.6 | 25.71 |
| 8. | Mavoor Tank | 178.06 | 97.93 | 35.6 | 44.53 |
| 9. | Dhathankulam | 52.83 | 24.3 | 8.98 | 19.55 |
| 10. | Nachikulam Tank | 127.40 | 30.58 | 33.12 | 63.70 |
| 11. | Reddi Tank | 44.22 | 11.5 | 12.82 | 19.90 |
| 12. | Vadugar Tank | 24.33 | 5.11 | 6.81 | 12.41 |
| 13. | Vadakarai Tank | 801.70 | 238.61 | 222.7 | 340.39 |
| 14. | Kattakulam Tank | 347.37 | 100.74 | 93.79 | 152.84 |
| 15. | Thanichiyam Tank | 433.20 | 121.3 | 155.95 | 155.95 |
| 16. | NagariPudhukulam Tank | 36.84 | 8.83 | 9.94 | 18.07 |
| 17. | Thiruvalavayanallur Tank | 148.80 | 30.08 | 35.55 | 83.17 |
| 18. | NedunkulamPudhukulam | 43.72 | 10.93 | 13.99 | 18.80 |
| 19. | NedunkulamPeriyakulam | 60.70 | 15.79 | 18.22 | 26.69 |
| 20. | ThenurPudhukulam Tank | 51.82 | 12.96 | 15.03 | 23.83 |
| 21. | ThenurPeriyakulam | 274.38 | 76.63 | 98.52 | 99.23 |
| Total area | 3325.87 | 1126.66 | 889.93 | 1309.28 |
Among the 21 tanks which are coming under the Sirumalaiyar sub basin, the tanks namely Vadakarai tank, Thanichiyam tank and kattakulam tank had maximum ayacut area with 801.70, 433.20 and 347.37 ha respectively.
Agaramkulam and ThenurPeriyakulam are having significant ayacut area of 290.76 ha and 274.38 ha respectively.
2.3. Climate and Rainfall
The entire sub basin of Sirumalaiyar consisted of cluster villages in Madurai and Dindigul Districts. With respect to the Dindigul part of Sirumalaiyar basin is concerned the normal annual rainfall varies from about 700 mm to about 1600 mm. The basin in Dindigul district enjoys a tropical climate. The period from April to June is generally hot and dry. The weather is pleasant during the period from November to January. Usually mornings are more humid thanafternoons. The Relative Humidity varies between 65 and 85% in the mornings while in the afternoon it varies between 40 and 70%.
With respect to Madurai part of Sirumalaiyar sub basin is concerned, the analysis of long term rainfall data shows that the basin receives rainfall during NE monsoon (47%) , SW monsoon (32%), summer (17%) and winter (4%). The normal annual rainfall varies from 806 mm to 964.1 mm. The entire basin experiences a declining trend in annual rainfall. The climate is subtropical and the temperature varies from 15 to 41°C in the basin. The relative humidity varies from 45 to 85% and is high during NE monsoon.
2.4. Soil type
The major soil types in Dindigul part of Sirumalaiyar sub basin is red Soil, red Sandy Soil & black Cotton Soil whereas the major soil types in Madurai part of Sirumalaiyar sub basin is Red soil, Black Soil & Sandy Soil.
3. Cropping pattern in the sub basin
- Rice (June-Sep.) - rice (Oct.-Jan.) - pulses (Feb.-April)
- Rice (June-Sep.) - rice (Oct.-Jan.) - green manure (Feb.-April)
- Sugarcane - ratoon sugarcane (Nov.-Dec.) - (2 years rotation)
- Banana - ratoon banana (June-March) - (2 years rotation)
4. Field Interventions
In Madurai cluster villages the following interventions are proposed
- Green manure followed by Rice
- Precision farming in Banana
In Dindigul cluster villages the following interventions are proposed
- IPT in Garden land Pulses
- Precision Farming in Vegetables
The proposed interventions will help in enhancing the yield, income and livelihood of the farmers.
4.1. Green manure + SRI
Under high input production systems where productivity cannot be further increased with incremental use of mineral fertilizers alone, addition of organic sources could increase yields through increased soil productivity and higher fertilizer use efficiency. Green manuring of rice is a well established practice and saving of fertilizer N through green manuring ranged from 30 to 100 kg N ha-1. The magnitude of leaching, de nitrification and NH3 volatilization losses are lower for green manure-N than for fertilizer-N. In addition, green manures provide N and other mineral nutrients for the immediate need of the growing rice crop and improve soil physical and chemical properties. There was considerable buildup of soil organic carbon content due to the addition of organic N sources especially green manures. Combined application of fertilizer and green manure increased the efficiency of each other.
The average N loss in flooded soils from applied green manures was considerably lower thus resulting in less pollution to the environment. With similar N use efficiencies, green manure – N is less prone to loss mechanisms than mineral N fertilizer and may therefore contribute to long term residual effects of soil productivity. Green manures increased the availability of P through the mechanism of reduction, chelation and favourable changes in soil pH. They also mobilize S, P, Si, Zn, Cu, Mn and other nutrient elements as a result of increased microbial activity (CO2 formation) and decreased redox potential. Green manuring decreased bulk density, increased water stable aggregates, pore space, water intake and water retention. There was considerable built up of soil organic carbon content due to the addition of green manures. Green manuring increased the growth, yield parameters, nutrient uptake and yield of rice. With Sesbania aculeata, fertilizer N to rice could be reduced to 50 per cent of the recommended dose. Mixed application of green manure and mineral fertilizer increased overall utilization of nitrogen than when they were applied separately. From the foregoing review, it is well established that the practice of green manuring increasing rice production by supplying nutrients and maintaining soil productivity. (Selvi and Kalpana, 2009)
| S.No. | Technology | Total area (ha) | Unit cost (Rs.) | Total cost(in lakhs) |
|---|---|---|---|---|
| 1 | GM-SRI | 100 | 8000 | 8.00 |
Details of Unit Cost: Green Manure
| S. No. | Particulars | Amount (Rs.) |
|---|---|---|
| 1. | Seed cost 40 kg/ha @ Rs. 50/kg | 2000.00 |
| Grand Total | 2000.00 |
Details of Unit Cost: Rice
| S. No | Particulars | Amount(Rs.) |
|---|---|---|
| 1 | Cost of Soil testing | 20.00 |
| 2 | Seed cost - 10 kg/ha @ Rs.30/kg | 300.00 |
| 3 | Cost of nursery raising | - |
| 4 | Cost of fertilizers (150:50:50 kg NPK / ha) | |
| Urea - 300 kg/ha @ Rs.6 /kg | 1,800.00 | |
| Muriate of Potash – 80 kg @ Rs.16/kg | 1,280.00 | |
| ZnSO4 25 kg @ Rs.40/kg | 1,000.00 | |
| 5 | Bio fertilizer & Bio inoculants | 1,600.00 |
| Grand Total | 6,000.00 |
4.2. Area enhancement, area expansion and productivity enhancement of pulses under crop diversification in gap areas:
The productivity of pulse is very low in farmers’ field due to the lack of application of improved technologies. The interventions in the form of application of Pulse wonder and DAP spray would go a long way in increasing the yield in pulses.
| S.No. | Technology | Total area (ha) | Unit cost (Rs.) | Total cost(in lakhs) |
|---|---|---|---|---|
| 1 | Area enhancement, area expansion and productivity enhancement of pulses under crop | 100 | 5000 | 5.00 |
Details of Unit Cost: Area expansion Pulses
| S. No | Particulars | Amount(Rs.) |
|---|---|---|
| 1. | Cost of Soil testing | 20.00 |
| 2. | Seed cost with seed treatment - 20 kg / ha @ Rs.150/kg | 3,000.00 |
| 3. | DAP 25 kg / ha @ Rs.22.50/kg | 560.00 |
| 4. | Pulse Wonder 2 kg/ha @ Rs.220/kg | 440.00 |
| 5. | Bio fertilizers and Bio inoculants | 980.00 |
| Grand Total | 5,000.00 |
4.3. Production of Banana under Precision farming mode by adopting of IPM concept
Advantages in adoption of drip irrigation in banana over flood irrigation is observed as 8.46% higher,17.24% more as girth of plants,2.94% more leaves, 40% more bunch weight and yield is 21.95 % is more. Fruit setting takes place 28 days earlier and average harvesting period is less by 32 days. There is a saving of 38.82 % water. (Sharma and Kispotta, 2016).
| S.No. | Technology | Total area (ha) | Unit cost (Rs.) | Total cost(in lakhs) |
|---|---|---|---|---|
| 1 | Production of Banana under Precision farming mode by adopting of IPM concept | 6 | 120000 | 7.20 |
Details of Unit Cost Banana
| S. No | Particulars | Amount(Rs.) |
|---|---|---|
| 1 | Drip cost as per the Govt. norms @75% Subsidy | 64,200.00 |
| 2 | Cost of Seedlings | 40,000.00 |
| 3 | Water Soluble fertilizers | |
| SOP – 450 kg @ Rs.75/kg | 14,400.00 | |
| 4 | Bio fertilizer & Bio inoculants | 1,400.00 |
| Total | 1,20,000.00 |
4.4. Production of Vegetables under Precision farming mode by adopting of IPM concept
‘Precision Farming’ or ‘Precision Agriculture’ aims at increasing productivity, decreasing production costs and minimizing the environmental impact of farming. The management of in-field variability in soil fertility and crop conditions for improving crop production and minimizing the environmental impact is the crux of precision farming.
Studies revealed that adoption of precision farming leads to about 80 per cent increase in yield in tomato and and 34 per cent in brinjal. Increase in gross margin has been found 165 per cent and 67 per cent in tomato and brinjal production, respectively. The contribution of technology for higher yield in precision farming has been recorded as 33.7 per cent and 20.5 per cent, respectively in tomato and brinjal. (Maheswari et al., 2008)
The analysis of economics of crop cultivation under drip and control has revealed that the drip method of irrigation has a significant impact on resources saving, cost of cultivation, yield of crops and farm profitability. The physical water and energy productivity is significantly high in drip over the flood method of irrigation. One could conclude that the drip has a significant bearing on the private costs and benefits and hence on profit of farmers. The study has revealed that adoption of drip irrigation technology has increased the net sown area, net irrigated area and thereby has helped in achieving higher cropping intensity and irrigation intensity. (Suresh kumar and Palanisamy, 2010).
| S.No. | Technology | Total area (ha) | Unit cost(Rs.) | Total cost(in lakhs) |
|---|---|---|---|---|
| 1 | Production of Vegetables under Precision farming mode by adopting of IPM concept | 8 | 120000 | 9.60 |
Details of Unit cost: Vegetables
| S. No | Particulars | Amount (Rs.) |
|---|---|---|
| 1. | Drip cost as per the Govt. norms @ 75 % subsidy | 75,000.00 |
| 2. | Cost of Seed/Seedlings | 25,000.00 |
| 3. | Water Soluble fertilizers | |
| 19:19:19-100 kg @ Rs.75/kg | 7,500.00 | |
| Urea - 200 kg @ Rs.6/kg | - | |
| MAP-50 kg @ Rs.90/kg | 4,500.00 | |
| SSP-100kg @ Rs.7.5/kg | 750.00 | |
| 4. | Bio fertilizer | 1,750.00 |
| 5. | Mulching sheets & Laying | 5,500.00 |
| Grand Total | 1,20,000.00 |
4.5. Formation of Pulse Commodity groups and federated to FPO (Seed to sales) and later linking with Marketing Department.
| S.No. | Technology | Total area (ha) | Unit cost (Rs.) | Total cost(in lakhs) |
|---|---|---|---|---|
| 1 | Formation of Pulse Commodity groups and federated to FPO (Seed to sales) and later linking with Marketing Department. | 25 | 2,000 | 0.50 |
4.6. Promotion of Pesticide Free Vegetables in sub basins through climate resilience activity in model Bio villages known as pesticide free villages
| S.No. | Technology | Total area (ha) | Unit cost (Rs.) | Total cost(in lakhs) |
|---|---|---|---|---|
| 1 | Promotion of Pesticide Free Vegetables in sub basins through climate resilience activity in model Bio villages known as pesticide free villages | 80 | 2,500 | 2.00 |
Farm implements:
| S.No. | Technology | Quantity | Unit cost (Rs.) | Total cost(in lakhs) |
|---|---|---|---|---|
| 1 | Cono weeder | 100 | 1000 | 1.00 |
5. Capacity Building & Information, Education & Communication
5.1. Capacity building
5.1.1. Training to stakeholders
Under this activity, imparting training to all the beneficiaries either as off-campus or as on-campus is planned.
| Sl. No. | Particulars | Duration (days) | No/batch | Total batch | Budget / batch | Total budget (lakhs) |
|---|---|---|---|---|---|---|
| 1. | Nursery technology for SRI paddy | 1 | 50 | 10 | 10,000 | 1.00 |
| 2. | Seed production in Pulses | 1 | 50 | 10 | 10,000 | 1.00 |
| 3. | Precision farmingpractices for vegetables | 1 | 50 | 10 | 10,000 | 1.00 |
| 4. | Precision farming practices for Banana | 1 | 50 | 10 | 10,000 | 1.00 |
| Total | 4.00 |
5.1.2. Exposure visit
In-order to have practical knowledge on various improved farming practices prevailing across the District and State, it has been proposed to expose the stakeholders by organizing educational tours for having better cross learning.
5.2. IEC including Awareness creation, documentation and IEC equipment
5.2.1. Organize awareness campaign
Informal meetings with Farmers / Water Users Association through PRA methods – Focus group discussion and transect walk.
- Organizing informal meetings in sub basin villages
- Message on AIR / local cable TV
- Ensure transparency
- Explain about the scheme – organization objectives, activities, project contribution and farmers share
- Emphasis the role of stake holders in the project
- Project the expected benefit
5.2.2. Documentation
- Maintenance of records and registers
- Field note for each activity
- Daily memorandum sheet
- Receipt and issue of inputs
- Technical observations on soil, water and crop
- Printing pamphlets about the scheme
- Wall paintings
5.2.3. IEC Equipments
- Purchase of Laptop, Camera and computer accessories
5.2.4. Out sourcing charges on vehicles
- Expenditure on TA /DA for the purpose of TN-IAM Project
- Fuel bill of university vehicle utilized for the project
- Hire charges of university vehicle utilized for this purpose
6. Management Cost
6.1. Outsourcing of technical staff
Outsourcing of technical staff is included in TNAU sub basin plan to carry out the field activities.
7. Yearwise crop based activities
| S. No | Particulars | ||||||||
|---|---|---|---|---|---|---|---|---|---|
| A | Activities | Unit costRs/ha | P | P | P | P | P | P | P |
| 1 | GM-SRI | 10000 | 20 | 20 | 20 | 20 | 20 | 0 | 100 |
| 2 | TFL seed production on pulses | 5000 | 20 | 20 | 20 | 20 | 20 | 0 | 100 |
| 3 | Vegetable under precision farming and IPM concept | 120000 | 3 | 5 | 0 | 0 | 0 | 0 | 8 |
| 4 | Banana under precision farming and IPM concept | 120000 | 3 | 3 | 0 | 0 | 0 | 0 | 6 |
| Total | 46 | 48 | 40 | 40 | 40 | 0 | 214 |
Total Budget (Year wise) for Sirumalaiyar Sub basin
P-Physical in ha, F-Financial (Rupees in lakhs)
| S.No | Particulars | I Year | II Year | III Year | IV Year | V Year | VI year | Total | ||||||||
| A.Field intervention | Unit cost Rs/Ha | P | F | P | F | P | F | P | F | P | F | P | F | P | F | |
| 1 | GM-SRI | 8000 | 20 | 1.60 | 20 | 1.60 | 20 | 1.60 | 20 | 1.60 | 20 | 1.60 | 0 | 0.00 | 100 | 8.00 |
| 2 | Area Enhancement, Area Expansion and productivity enhancement of pulses under crop diversification in gap areas: | 5000 | 20 | 1.00 | 20 | 1.00 | 20 | 1.00 | 20 | 1.00 | 20 | 1.00 | 0 | 0.00 | 100 | 5.00 |
| 3 | Production of vegetable under precision farming mode by adopting of IPM concept. | 120000 | 3 | 3.60 | 5 | 6.00 | 0 | 0.00 | 0 | 0.00 | 0 | 0.00 | 0 | 0.00 | 8 | 9.60 |
| 4 | Production of Banana under precision farming mode by adopting of IPM concept. | 120000 | 3 | 3.60 | 3 | 3.60 | 0 | 0.00 | 0 | 0.00 | 0 | 0.00 | 0 | 0.00 | 6 | 7.20 |
| 5 | Formation of Pulse commodity groups and federated to FPO (Seed to sales) and later linking with the Marketing Dept. | 2000 | 5 | 0.10 | 5 | 0.10 | 5 | 0.10 | 5 | 0.10 | 5 | 0.10 | 0 | 0.00 | 25 | 0.50 |
| 6 | Promotion of Pesticide Free vegetables in sub-basins through climate resilience activity in model Bio Villages known as Pesticide Free Village | 2500 | 20 | 0.50 | 15 | 0.37 | 15 | 0.37 | 15 | 0.38 | 15 | 0.38 | 0 | 0.00 | 80 | 2.00 |
| Sub Total A | 71 | 10.40 | 68 | 12.67 | 60 | 3.07 | 60 | 3.08 | 60 | 3.08 | 0 | 0 | 319 | 32.30 | ||
| B.Implements for farm mechanization | ||||||||||||||||
| 1 | Cono weeder | 1000 | 20 | 0.20 | 20 | 0.20 | 20 | 0.20 | 20 | 0.20 | 20 | 0.20 | 0 | 0.00 | 100 | 1.00 |
| Sub Total B | 20 | 0.20 | 20 | 0.20 | 20 | 0.20 | 20 | 0.20 | 20 | 0.20 | 0 | 0.00 | 100 | 1.00 | ||
| Total (A+B) | 91 | 10.60 | 88 | 12.87 | 80 | 3.27 | 80 | 3.28 | 80 | 3.28 | 0 | 0.00 | 419 | 33.30 | ||
| II | IEC & CB | |||||||||||||||
| 1 | Capacity Building | |||||||||||||||
| a). Training to stake holders | 1.00 | 1.00 | 1.00 | 0.50 | 0.50 | 0.00 | 4.00 | |||||||||
| b). Exposure visit | 0.50 | 0.50 | 0.50 | 0.00 | 0.00 | 0.00 | 1.50 | |||||||||
| 2 | IEC | |||||||||||||||
| a).Awareness Creation | 0.50 | 0.50 | 0.50 | 0.25 | 0.10 | 0.00 | 1.85 | |||||||||
| b). Documentation | 0.40 | 0.40 | 0.40 | 0.10 | 0.10 | 0.10 | 1.50 | |||||||||
| c).IEC equipments | 0.75 | 0.00 | 0.00 | 0.00 | 0.00 | 0.00 | 0.75 | |||||||||
| d). Out sourcing charges on vehicles | 0.65 | 0.65 | 0.65 | 0.65 | 0.65 | 0.30 | 3.55 | |||||||||
| Total | 3.80 | 3.05 | 3.05 | 1.50 | 1.35 | 0.40 | 13.15 | |||||||||
| III | Out sourcing of technical staff | 1.44 | 1.59 | 0.65 | 0.50 | 0.47 | 0.00 | 4.65 | ||||||||
| Over all Total | 15.84 | 17.51 | 6.97 | 5.28 | 5.10 | 0.40 | 51.10 | |||||||||
|---|---|---|---|---|---|---|---|---|---|---|---|---|---|---|---|---|
Sirumalaiyar Sub basin (in lakhs)
| S.No | Intervention details | Unit cost Rs/ha | P | F |
|---|---|---|---|---|
| I | A.Field Activities | |||
| 1 | GM-SRI | 8000 | 100 | 8.00 |
| 2 | Area Enhancement, Area Expansion and productivity enhancement of pulses under crop diversification in gap areas: | 5000 | 100 | 5.00 |
| 3 | Production of vegetable under precision farming mode by adopting of IPM concept.(Cost inclusive of Sustainability and replication on the use of Water soluble fertilizers in the subsequent crops) | 120000 | 8 | 9.60 |
| 4 | Production of Banana under precision farming mode by adopting of IPM concept.(Cost inclusive of Sustainability and replication on the use of Water soluble fertilizers in the subsequent crops) | 120000 | 6 | 7.20 |
| 5 | Formation of Pulse commodity groups and federated to FPO (Seed to sales) and later linking with the Marketing Dept. | 2000 | 25 | 0.50 |
| 6 | Promotion of Pesticide Free vegetables in sub-basins through climate resilience activity in model Bio Villages known as pesticide free Village. | 2500 | 80 | 2.00 |
| B.Implements for farm mechanization Unit cost/ Group | 0.00 | |||
| 7 | Cono weeder | 1000 | 100 | 1.00 |
| Total | 419 | 33.30 | ||
| II | IEC & CB Unit cost/ Group | |||
| 1 | Capacity Building | |||
| a. Training to stakeholders | 4.00 | |||
| b. Exposure visits | 1.50 | |||
| 2 | IEC | |||
| Awareness creation activities | 1.85 | |||
| Documentation | 1.50 | |||
| IEC Equipments | 0.75 | |||
| Outsourcing of Vehicle and TA | 3.55 | |||
| Total | 13.15 | |||
| III | Management cost Unit cost/ Group | |||
| 1 | Out sourcing of technical staff | 4.65 | ||
| Overall total (I+II+III) | 51.10 |